AVS Risk Assessment Methodology
Introduction
This model quantifies maximum slashing risk, referred to here as Value at Risk (VaR), by analyzing slashing behavior across multiple node operators and AVSs. Notably, slashing one operator on a particular AVS does not guarantee that others will be slashed simultaneously, nor does slashing on one AVS imply slashing on all AVSs secured by the same operator.Building on Renzo's foundational work, this model extends the concepts of MaxLoss—representing the maximum percentage of stake that can be frozen or slashed per AVS—and RiskAdjustedReward, a metric akin to the Sharpe Ratio in traditional finance.The model provides a comprehensive risk-reward profile for restaking portfolios when combined with reward estimates.
Problem and Context
Liquid restaking tokens involve diverse operators and AVSs. On Renzo, each operator manages unique stakes across multiple onboarded AVSs. However, this stake is no longer rehypothecated following the announcement of the new EigenLayer Security Model.
See the @RenzoProtocol operator distribution below as an example:

Since AVS slashing is not yet live, historical data—commonly used in traditional finance—cannot be relied on.
Instead, the main purpose of this report is to:
1. Present a methodology for establishing initial risk estimates using minimal assumptions and parameters
2. Outline a set of intuitive initial parameters that can be updated as AVS slashing data becomes available. The report also proposes an update mechanism to adapt these parameters from informed priors to real-world data.
Causes of Slashing
Identifying the drivers of slashing is key to isolating the maximum slashing penalties relevant to this analysis. While some drivers pose inherent risks, others can be effectively managed through established mechanisms.
Slashing drivers can be categorized into the following distinct causes:
- Malicious operator behavior
- Bugs in AVS smart contract code or configuration
- Inadvertent slashing due to non-malicious operator error or external factors, such as challenges to the AVS, DoS attacks, or disruptions at the Internet service provider level
A closer examination of these causes suggests:
- Malicious operators can be managed through robust onboarding processes and legal measures at the LRT level. For instance, Renzo operators are contractually bound, and the potential for legal recourse acts as a deterrent against malicious activity.
- AVS slashing bugs can be mitigated by opting into EigenLayer StakeSure and conducting thorough due diligence on AVSs. StakeSure retains slashed stakes rather than burning them, restoring them if the slashing is deemed unwarranted.
- Inadvertent slashing due to non-malicious errors represents an unmitigated risk. As such, this is the primary focus of the initial Value at Risk (VaR) model.
Value Slashed
The maximum value that can be slashed by an AVS is limited to the Unique Stake dedicated to it. Under normal conditions, the percentage of Unique Stake slashed is expected to be significantly smaller than the total Unique Stake (see the case study at the end of this report)
💡Key Insight: The first major metric proposed in this model is the maximum slashing penalty (S) defined for an AVS due to accidental validator or hardware mistakes. Rather than focusing on the absolute maximum possible slashing penalty—typically the total Unique Stake, which is overly conservative—this model prioritizes the maximum likely slashing penalty that cannot be mitigated through other means.
For example, on most PoS chains, S is represented as the penalty for double signing.
- On the Ethereum Beacon Chain: The amount of ETH slashed due to double voting is 1/32 with the potential to increase slightly if more than 1% of validators are simultaneously slashed for the same offense (between 3% and 4% of the total ETH staked by the operator).
- On chains like BNBCHAIN: With fewer operators, larger individual stakes, and fixed penalties per slashing event, the maximum penalty is typically below 0.3% of the total amounts staked at a given time
TL;DR:
- Objective: Determine the Value at Risk (VaR) in the event of a slashing incident for a liquid restaking token distributed across multiple AVSs and node operators.
- Assumptions: The model assumes non-malicious operators and that funds within the AVS are protected by StakeSure. Therefore, the focus is on inadvertent slashing due to operator errors.
- Expectation: Such slashing events are anticipated to impact only a small percentage of the Unique Stake allocated to each AVS.
Value at Risk Model

Model Components
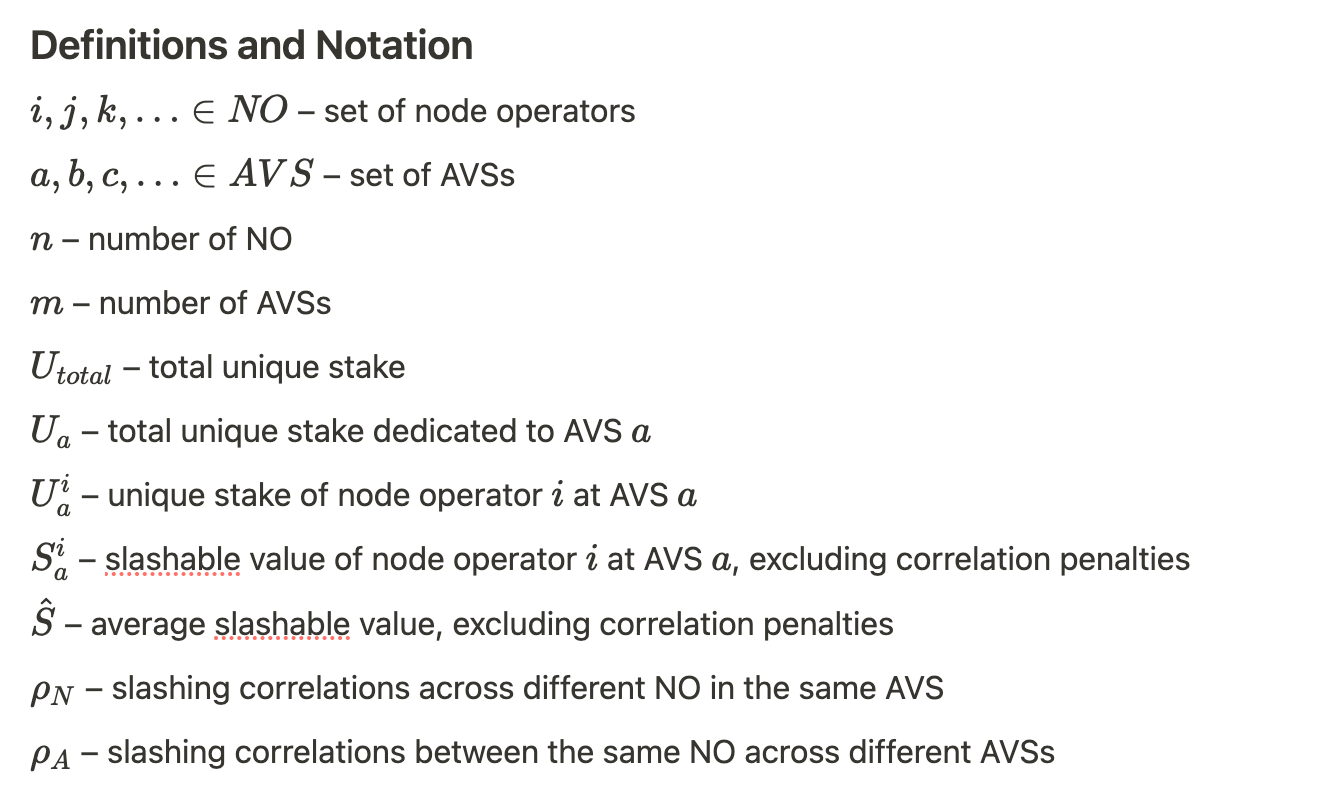
The total unique stake of a restaking portfolio is given by:
However, the focus is specifically on estimating the value at risk (VaR): the maximum amount slashable, to estimate the true slashing risk of an AVE-node operator set up. It is limited to a portion of Ua for each AVS a, as defined by the slashing rules of that AVS. In the absolute worst case, it’s bounded by:
Key idea: The model approximates VaR for a single slashing event as the highest slashable value among all node operators and AVSs, combined with the values slashed simultaneously from other node operators and AVSs, including correlation penalties if required.
1. Without loss of generality, the indices of AVS and node operators can be sorted by their value at risk, such that the first AVS and NO have the maximum VaR:
Since this represents the maximum single value at risk, it serves as the lower bound of the total value at risk. S equals the total VaR only when slashing correlations are zero.
2. The likelihood of simultaneous slashing can be approximated using the following two probabilities:

Initially, to reduce the parameter set in the absence of data, we assume that all of these correlations are equal and defined by two constants:
Recommendations for their initial values:
- pN: A small value, as correlated slashing across node operators has rarely been observed on the Beacon Chain. A value of 5% or lower is suggested. We encourage the audience to reason about this for themselves to get comfortable with the methodology, by we see no a priori reason why an error on one node operator should necessarily be repeated on others simultaneously, an assumption backed up by evidence on the Ethereum Beacon Chain.
- pA: A larger value, as a fault in an honest validator may affect all services it validates. A value of 80% or higher is suggested. This conservative assumption that if an operator makes an error on one AVS client, it will have an 80% chance of making an error on any other is impossible to forecast currently. We prefer to err on one side of caution and overestimate risk while we collect market data.
Correlated Slashing: Multiple Operators, Same AVS
Consider two scenarios. In the first, the AVS does not impose any additional penalties for simultaneous slashing. In this case, the expected additional value slashed by the AVS is given by:
The second scenario involves additional penalties for multiple operators being slashed simultaneously. These penalties can be expressed as a multiplier defined by a penalty function:
Otherwise, the correlated slashing penalties for different operators at AVS #1 is:
The loop ranges for indices from 1 to n-1 because the idea is to look at the value potentially slashed from all other node operators, without the node operator #1. The VaR for node operator #1 is established to be exactly S1^1, by assumption.
Correlated Slashing: Same Operator, Multiple AVSs
Since AVSs are independent, they will not have additional penalties due to simultaneous slashing. The formula is simply:
Combined Formula for Value at Risk
Summing it all together, the effective total value at risk can be written as:
Updating the Model
The $VaR$ changes whenever the unique stake amount or its distribution changes, as well as when the parameters pN and pA change.
Given new observations, such as a slashing event, an algorithm can recompute the values of pN and pA using Bayesian updating or a similar method, such as Maximum Likelihood Estimation.
If sufficient slashing data is available, the values of pN and pA can be estimated for each NO and AVS separately. Otherwise, at least in the early stages, maintaining single system-wide values for these parameters is more practical.
Since slashing events are infrequent, it will not be computationally demanding to rerun the update algorithm each time a slashing occurs, producing updated parameter distributions.
If there are no slashing events, the values of pN and pA can be tuned to gradually decrease with time.
Example
An interactive version of the model is available on Desmos.
Let the Renzo AVS delegations, operator configurations, and exposed slashing conditions be defined as follows:
- 5 AVSs
- 5 node operators, with 1000 ETH combined portfolio value:
- 200 ETH total stake for each operator
- unique stake distributed equally for each AVSs
- slashing penalty of 4% from the unique stake
- slashing correlations of pN = 5% and pA = 80%
The value that can be slashed per operator per AVS is:
During a slashing event the expected loss is:
- S = 1.6$ ETH from the first slashed operator
- Loss from operator 2 at AVS 1 quantified by Eq. 1a
- Loss from the operator 1 at AVS 2, 3, 4, and 5, quantified by Eq. 2
Writing it out:
In sum: the maximum loss this model predicts in a slashing event is 6.99 ETH, which is 0.7% of the total value of the portfolio.

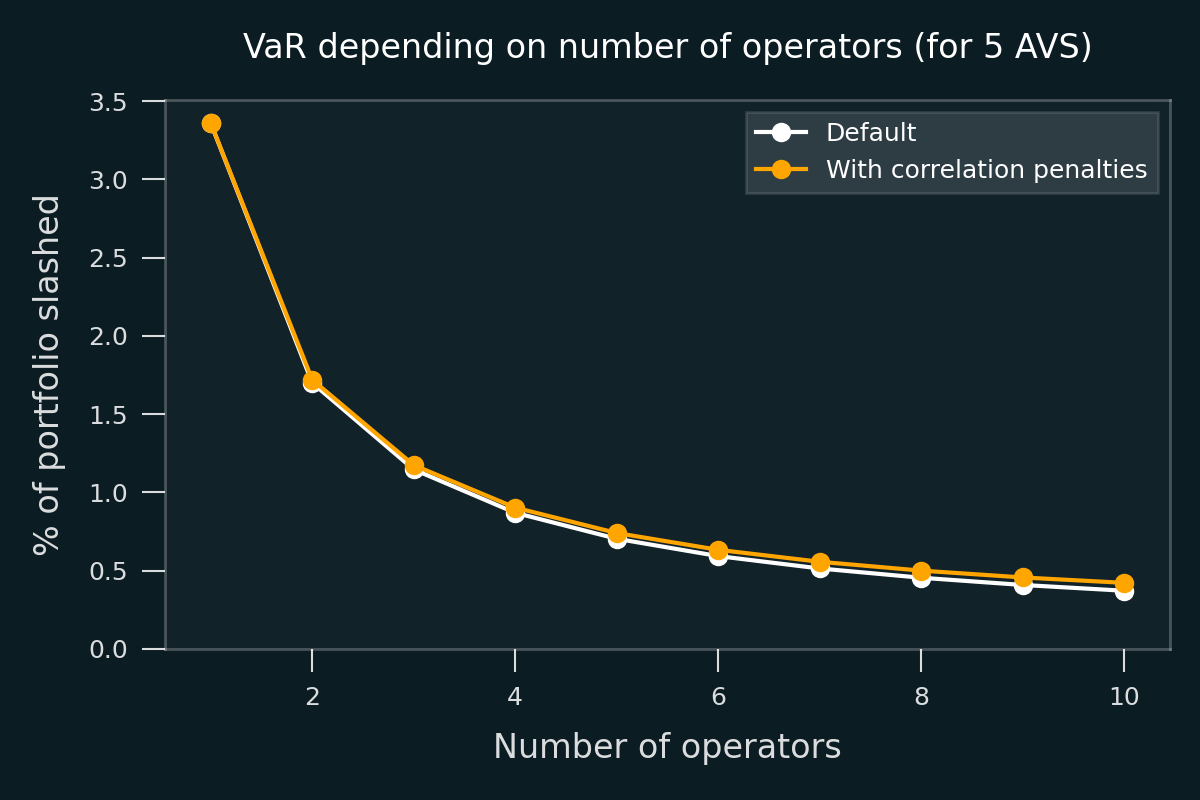
The figure above shows the VaR in % as a function from the number of operators. It’s clear that increasing the number of operators reduces the value at risk, since we expect slashing events to be only very weakly correlated between operators.
Adding correlation penalties increases the VaR, but only marginally, since the probability of multi-operator slashing is low. To be clear, more or less aggressive correlation penalty function could be used, leading to different results. The function used in this graph is the proportional penalty function: i.e. slashing N operators at once increases the penalty N times.

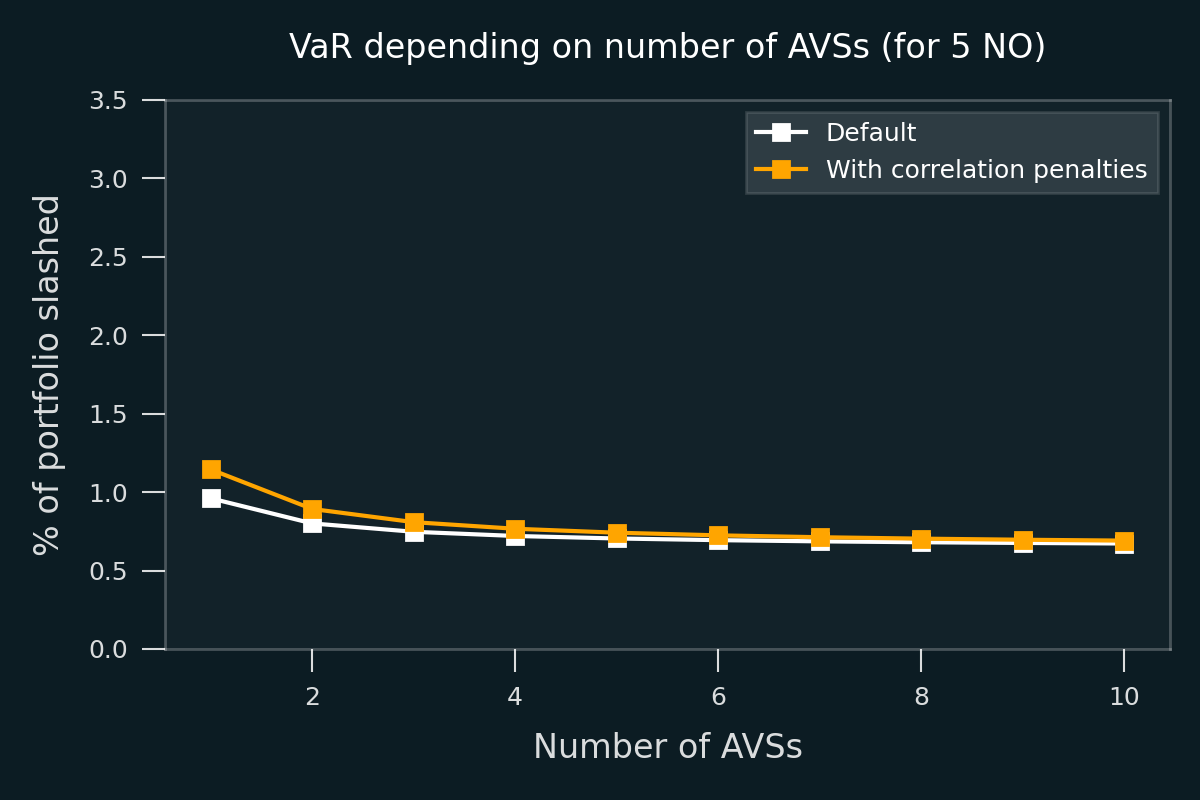
The figure above shows the VaR in % as a function from the number of AVSs. Increasing the number of AVSs reduces the risk, but only a little, since we use high slashing correlation between different AVS.
TL;DR: Summary of the Model
- The model (Desmos link) calculates the value at risk for a restaking portfolio in case of a slashing event.
- It uses the value at risk of a single operator in a single AVS as the basis.
- To this, it adds the value at risk from simultaneous slashing, estimated using correlations with other AVSs and operators.
- Optionally, the model can include additional penalties for mass slashing events.
Case Study: Slashing in PoS Blockchains
Due to the lack of AVS slashing data, the next best approximation for historical slashing risks comes from PoS blockchain staking.
Selection of Chains
For the study we selected:
- Ethereum – As the main PoS chain, Ethereum was one of the first to implement slashing and offers a wealth of easily accessible slashing data.
- Gnosis – As one of Ethereum's first side chains, Gnosis features similarly well-structured and accessible slashing data.
- Cosmos SDK chains, including Binance Smart Chain (BSC) – these chain use a more centralized validator set, which resembles AVS operators.
Value Being Slashed
On Ethereum and Gnosis Chain:
- A validator initially loses 1/32 of their stake when slashed.
- Additionally, the validator incurs attestation penalties between the slashing epoch and the withdrawable epoch. On Ethereum, this period spans 8192 epochs (36 days) after the slashing event, amounting to less than 0.1 ETH.
- Finally, correlation penalties may apply. However, these penalties require simultaneous slashing of thousands of validators and have not been observed on Ethereum.
- Total expected loss: Approximately 3.4% of the staked capital.
On Cosmos SDK chains, including BSC:
- Slashing penalties apply not only for attestation and proposal violations (e.g., double voting) but also for inactivity.
- The default Cosmos SDK configuration uses 5% penalty for double signing and 1% for inactivity.
- Cosmos, Osmosis, Terra, Akash has kept the 5% default setting for double signing.
- Celestia has reduced the double signing penalty to 2%
- Interestingly, Harmony One (a similar model, but a distinct codebase from Cosmos) uses proportional slashing penalties, bounded to 2% as a minimum. For instance, the slashed validators control 10% of the total stake, the penalty will be 10%.
On BSC specifically:
- Penalties for offenses are fixed:
- 200 BNB for double-voting.
- 10 BNB for inactivity.
- Income from the last 24-hour period is also redistributed from the offending validator.
- There are only 45 active validators, some operated by the same entity, with stakes ranging from 1.8M BNB to 66k BNB.
- Total expected loss: Ranges from 0.01% to 0.3% of the total stake, depending on the validator's capital.
Probability of Being Slashed
In short: slashing is a rare event.
On Ethereum:
- Number of active validators: 1,073,217
- Number of total validators: 1,666,218
- Number of validators slashed: 449
- Probability of slashing: 0.027%
On Gnosis Chain:
- Number of active validators: 309,921
- Number of total validators: 412,578
- Number of validators slashed: 1,128
- Probability of slashing: 0.27%
It’s interesting to note that the probability of slashing on Gnosis Chain is an order of magnitude higher than on Ethereum. Possible explanations include:
- Less experienced operators due to the lower entry barrier.
- A mass slashing event in July 2023, where hundreds of validators (likely from the same operator) were slashed.
- A higher number of validators per operator, as the value required to run a validator is much lower on Gnosis Chain.
On BSC and other Cosmos SDK chains:
- Historical data for slashing events on these chains is not as easily accessible. On BSC, during certain periods, slashing of principal capital was impossible due to a bug, skewing any statistics.
- However, the information that is available indicates that slashing of principal capital has been extremely rare if at all present on BSC.
Time Dependency of Slashing Probability
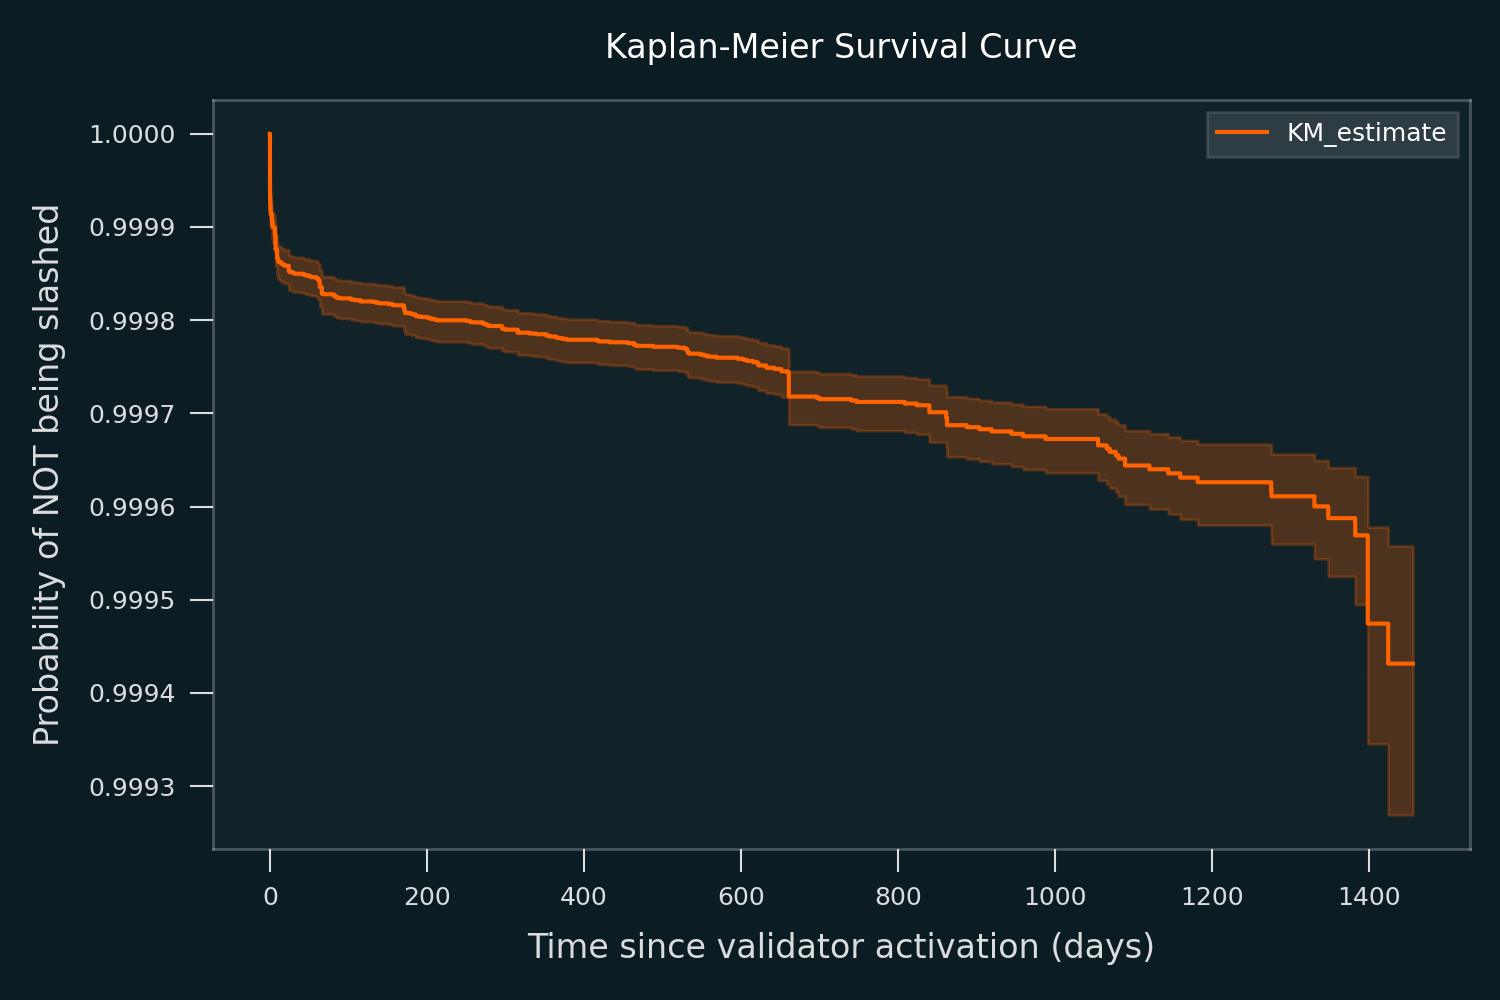
Using Ethereum’s data, the probability of being slashed depends weakly on the lifetime of the chain, but more strongly on the time since a validator's activation. This dependency is a good news for restaking, as it means that:
- Established methods such as Survival analysis can be used to predict the slashing probability.
- Risks can be reduced by relying on validators that have been in operation longer.
The figure below shows the Kaplan-Meier survival curve fitted to empirical Ethereum validator data. It’s clear that the highest rate of slashing happens during the first few days of a validator’s operation. This relationship between validator activation time and slashing risk could be incorporated into the $VaR$ model in future iterations.

Connecting the Case Study to the Model
Can the case study be used to estimate pN and pA? It’s not trivial, since Ethereum’s and Gnosis chain’s stake distribution among operators is very different from what’s expected in the AVS world. Still, some points of note:
- Slashing doesn’t seem to be correlated at all across multiple operators, except during the first days after the chain was launched (when there is a higher risk of misconfiguration for all operators), suggesting values of pN close to zero.
- For on a small operator, it is not unlikely that a large % of their nodes get slashed at once, suggesting values of pA closer to one than to zero.
- For a large operator, even for those responsible for the largest slashing events like staked.us and Bitcoin Suisse (108 and 99 validators slashed, respectively), less than one percent of all their validators got slashed simultaneously. However, this is not as relevant to the case of AVS, since it’s unlikely that any operator will have to run thousands of validators in that setting.
TL;DR: Summary of the Case Study
- Slashing of principal capital is rare across all three chains analyzed. It occurs most frequently on Gnosis Chain, where the entry requirements are the lowest.
- There have been some group slashing events affecting 100 or more validators, but none have been large enough to trigger the additional correlation penalties.
- While it may seem obvious, historical data confirms that newly launched validators are more likely to be misconfigured compared to long-running validators.
Incorporating Returns
In order to estimate the risk-adjusted returns, let’s use a modified version of Risk-Adjusted Reward Ratio (RAR) from the Renzo article, denoting the operational expenses with OpEx. The idea behind this indicator is similar to the Sharpe ratio used in traditional finance:
The AVS are expected to have different reward rates, scaled proportionally to the Unique Stake denoted to them:
where Ra is the reward rate of AVS a. By combining the reward and risk metrics together in this way, the attractiveness of a restaking portfolio can be quantified with a single number. This gives a clear mathematical goal when optimizing the portfolio allocation across AVSs and node operators.
Note: We recommend allocating total stake across AVSs in a manner that maximizes the Risk Adjusted Reward RAR.
References
- EigenLayer: Operators, Services and Slashing Equitability https://daic.capital/blog/eigen-layer-slashing-mechanism
- Introducing the EigenLayer Security Model: A Novel Approach to Operating and Securing Decentralized Services https://www.blog.eigenlayer.xyz/introducing-the-eigenlayer-security-model/
- StakeSure research paper: https://arxiv.org/abs/2401.05797
- Upgrading Ethereum: Slashing https://eth2book.info/capella/part2/incentives/slashing/
- Validator Slashings: Beacon Chain https://beaconcha.in/validators/slashings
- Validator Slashings: Gnosis Chain https://gnosischa.in/validators/slashings
- BSC Slashing Overview https://docs.bnbchain.org/bnb-smart-chain/slashing/overview/
Ethena Integrates Chaos Proof of Reserves
Ethena has officially integrated Chaos Proof of Reserves (PoR). With this integration, reliable, independent reserve verification is now live for USDe, providing a higher-frequency, programmatic alternative to traditional attestations.
dydx Re-launch Rewards Explainers
Market makers and traders can earn dydx rewards based on their activity and contributions, with traders earning points through taker fees and market makers earning points by fulfilling orders and providing liquidity. Points are weighted differently across markets, and rewards are distributed proportionally based on a 7-day TWAP of the dydx price.
Risk Less.
Know More.
Get priority access to the most powerful financial intelligence tool on the market.