Compound Multi Chain Risk Monitoring Hub
Table of Contents
Overview
Compound is a decentralized borrowing and lending protocol leader within the DeFi ecosystem. As one of the largest lending protocols globally, it requires sophisticated analytics, risk monitoring, usage analysis, trend identification, and more.
Chaos Labs has been selected to partner with Compound via the Grants program, launching a state-of-the-art Compound Cross-Chain Analytics and Observability platform. This platform extends granular analytics and observability across all EVM-compatible Compound deployments, enabling the Compound community to tap into a wealth of protocol-related data and risk information through one integrated, all-encompassing platform.
The Compound Cross-Chain Analytics and Observability platform empowers users with deeper insight into the overall risk and health of the Compound protocol across all deployments. The platform facilitates macro-level decision-making, providing vital information about assets deployed across multiple chains, thus equipping users to make informed and strategic decisions. On top of that, it offers in-depth insights into the use of Compound, trends, and real-time data analysis.
Platform Deep Dive
Cross-Chain Risk Overview
The main section of the Cross Chain Risk Monitoring Hub provides a single pane of glass to high-level metrics, aggregated across all Compound V3 chains and borrow markets, including total supply (earning and collateral), total borrow, TVL, and the sum of collateral at risk of liquidation.
Cross-Chain Exposure by Collateral Asset
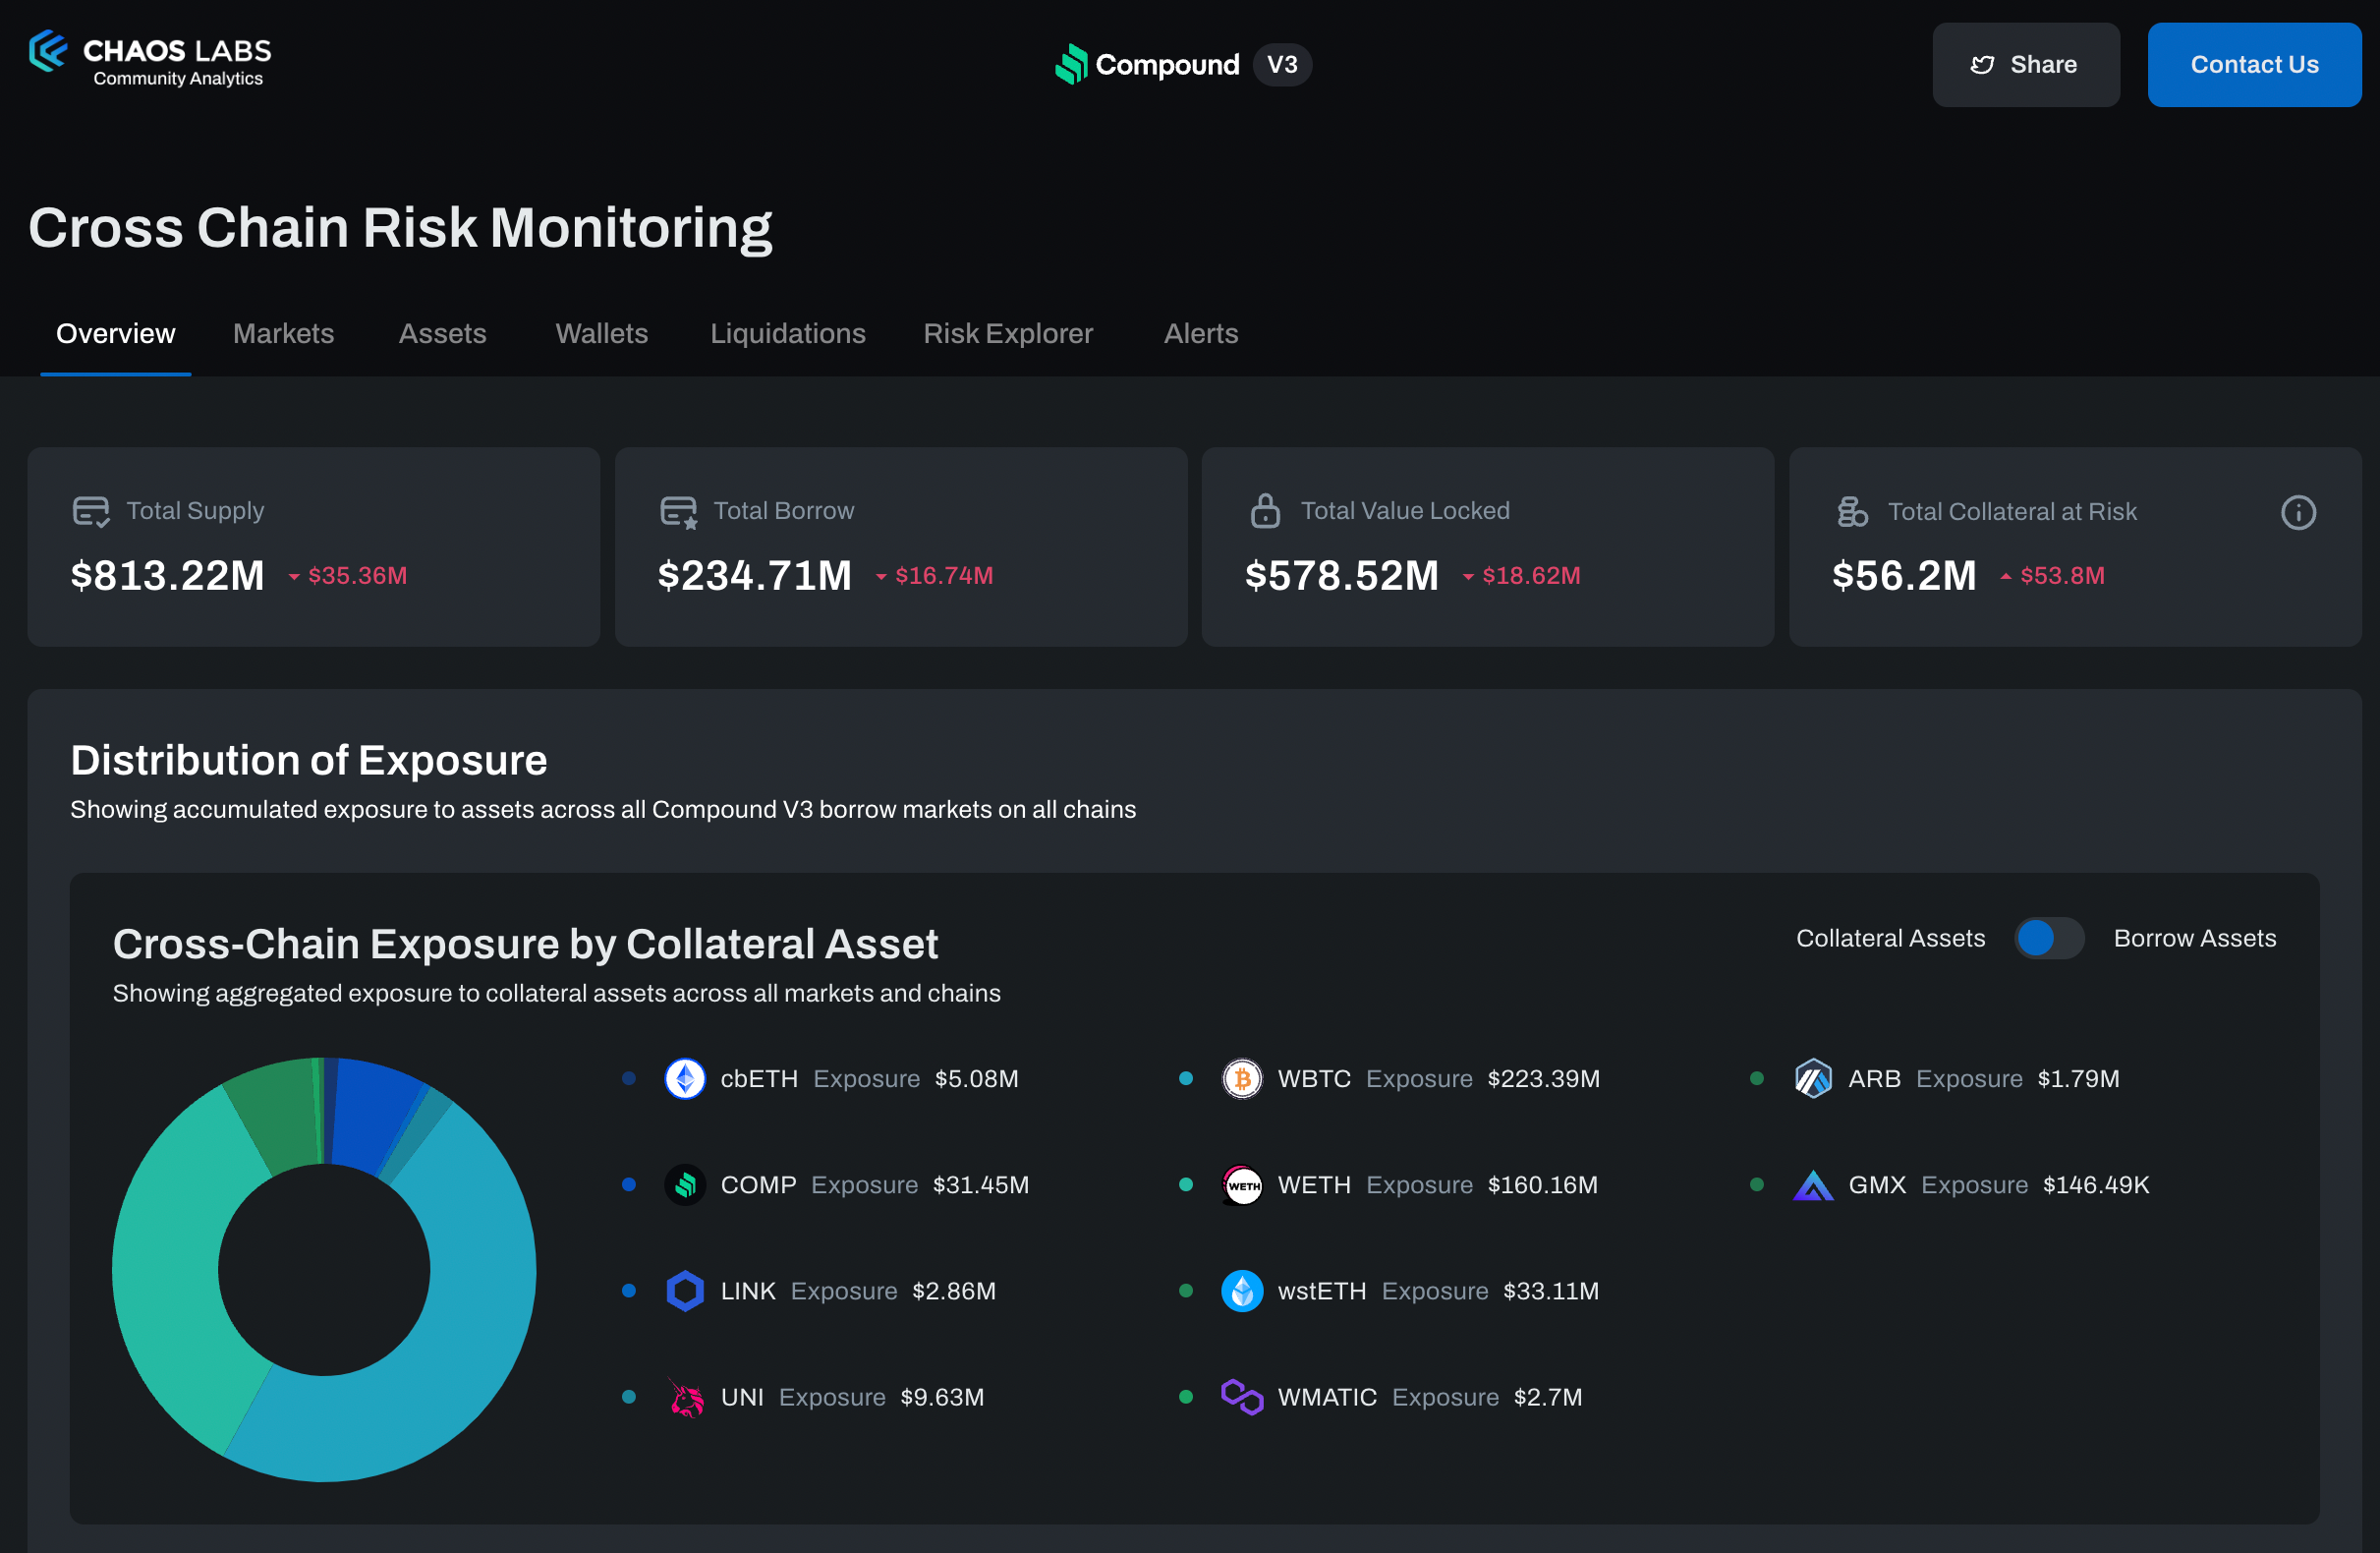
Displays the current protocol exposure to different assets across all chains and borrow markets and can be toggled between collateral and borrow assets. This view surfaces key information about the protocol such that Compound V3 is mostly exposed to WBTC and WETH as collateral assets and USDC as the leading borrow asset.
Backing Collateral Composition

Displays how asset exposure is trending over time.
Supply, Borrow, and Collateral at Risk
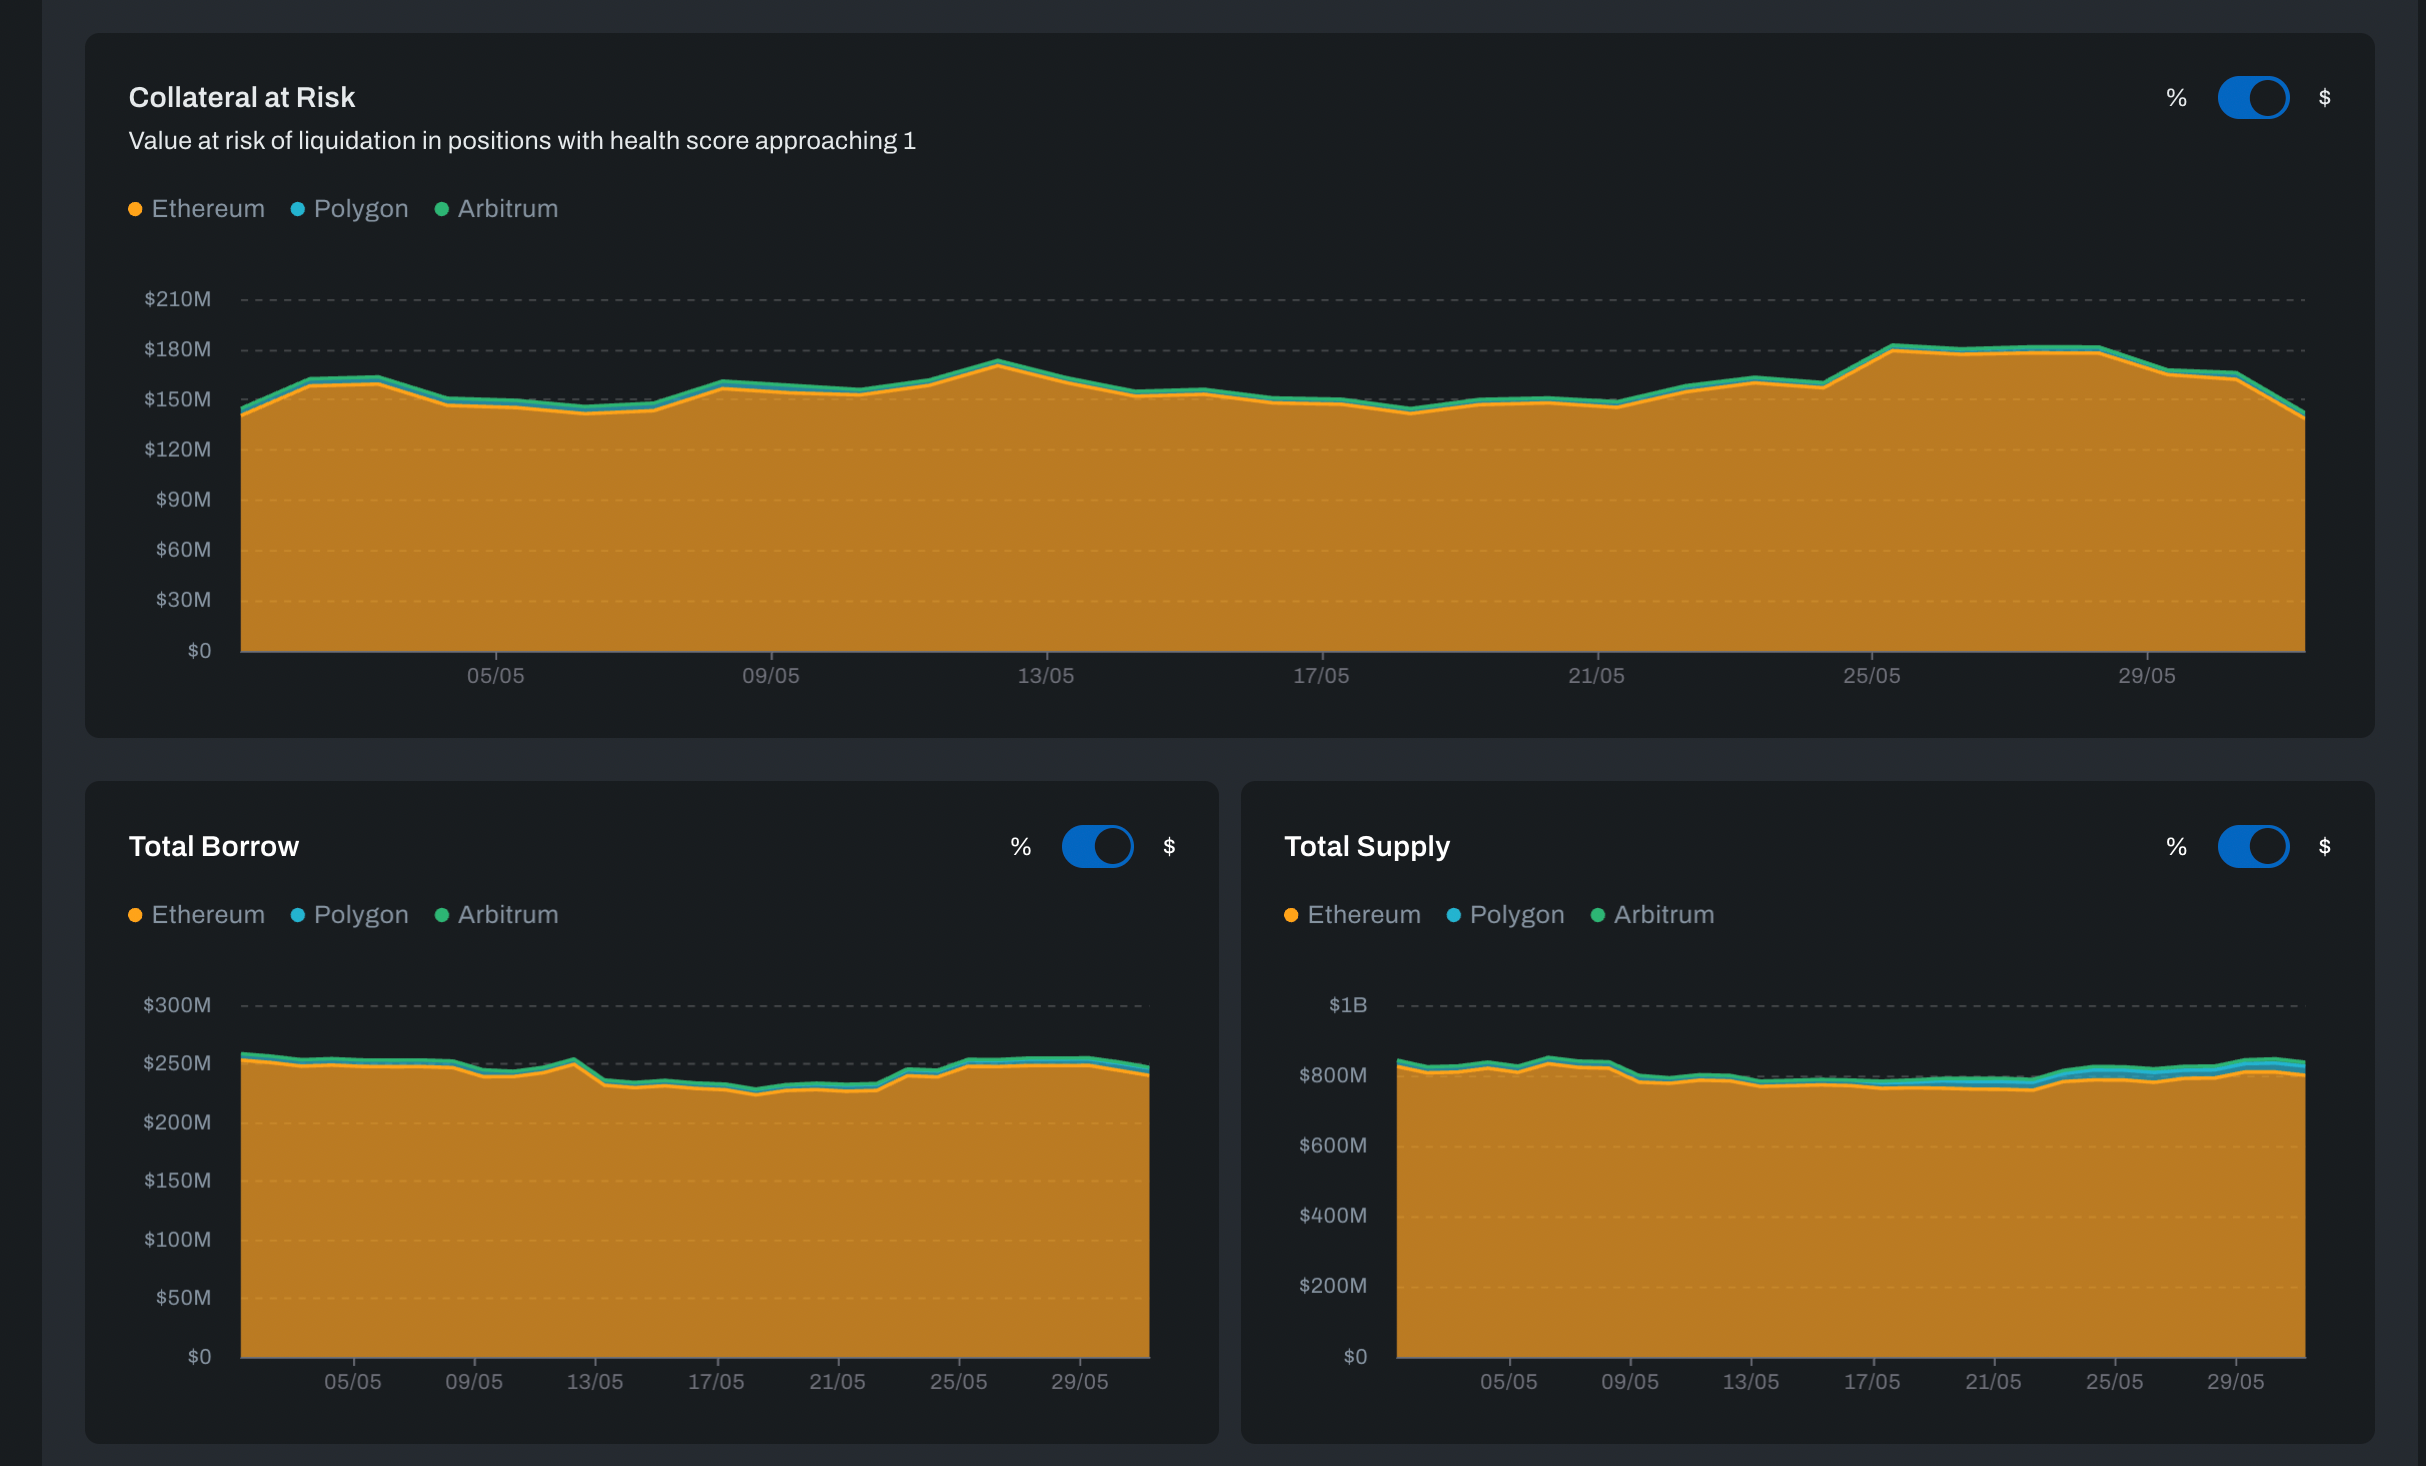
Displays how the total supply of earning and collateral assets, total borrow, and the total collateral at risk - values in wallets with low health factor that is approaching liquidation - over time. Each chart can be toggled between USD amount and relative percentage.
Supply and Borrow dominance

Displays, for each chain, what is the relative amount of supply and borrow on Compound V3 from the chain TVL. This is a high-level indication of market share and enables the differentiation between protocol net growth and chain growth.

The chains breakdown table consolidates per-chain key information in an easy-to-view table, including indicators of risk and growth. The chain Health Score provides a high-level indication that the protocol growth on the chain is trending well. This metric is added after an initial ramp-up time for the protocol on each chain, is currently enabled for Ethereum and Polygon, and will be enabled for the Arbitrum chain after an initial growth period.
Markets
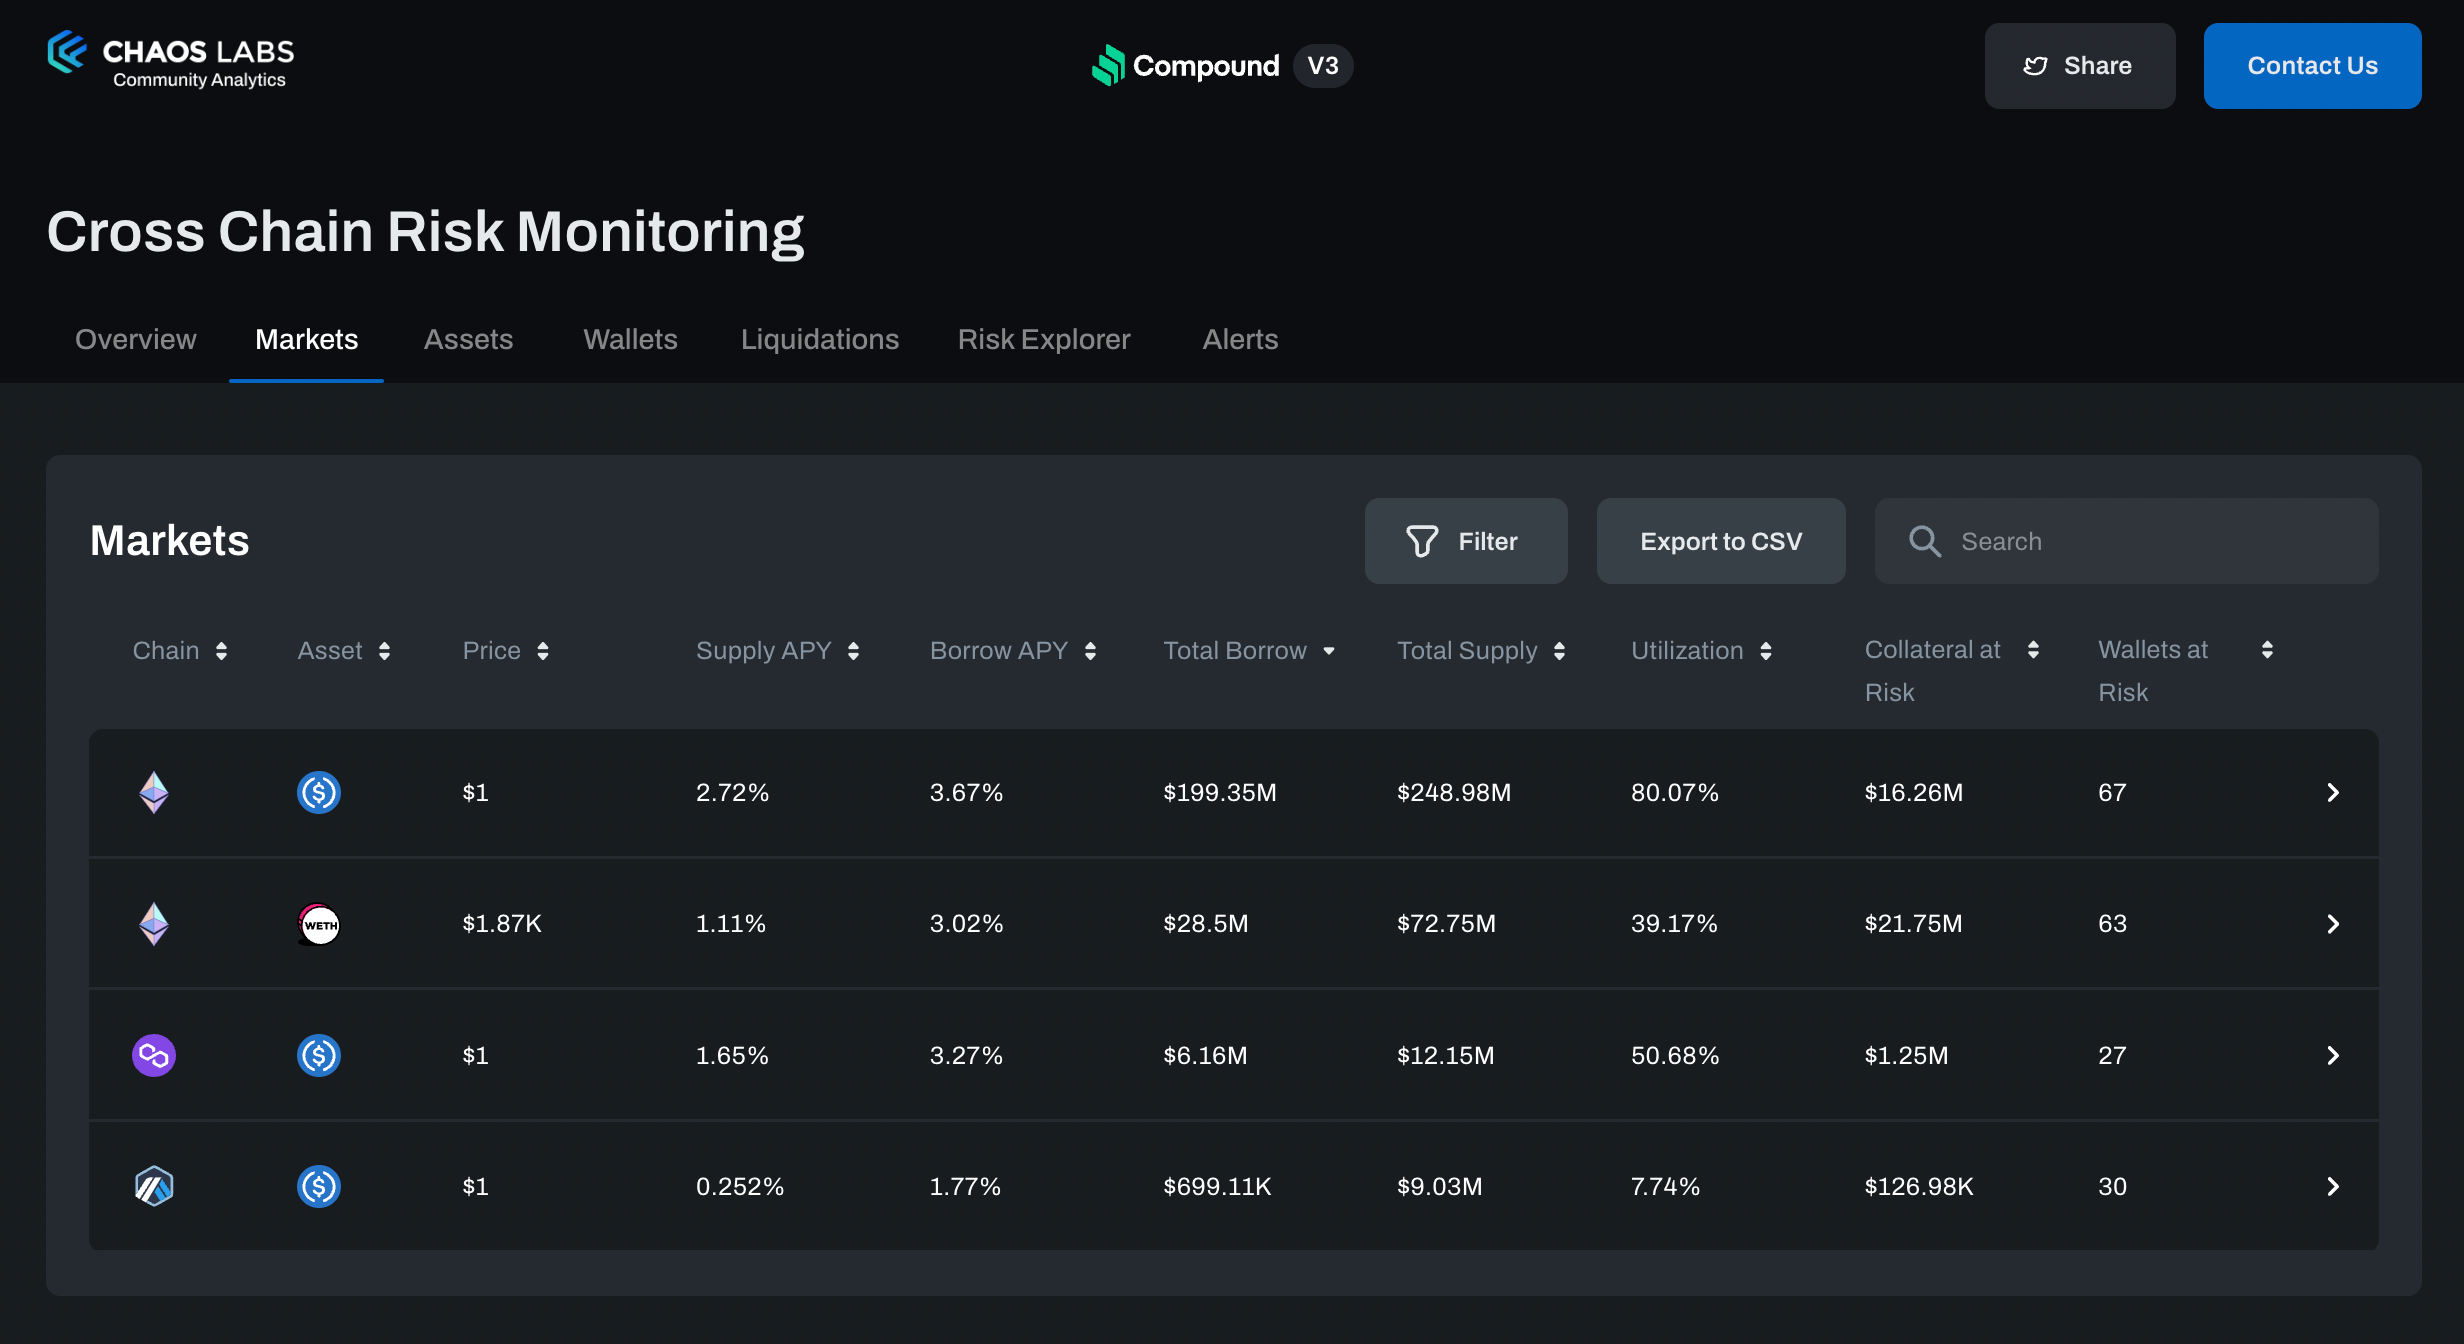
The Markets page consolidates information about all Compound V3 borrow markets across all chains, including borrow and supply status, APYs, and collateral at risk. The table can be filtered and exported to CSV as needed.
Market Detail
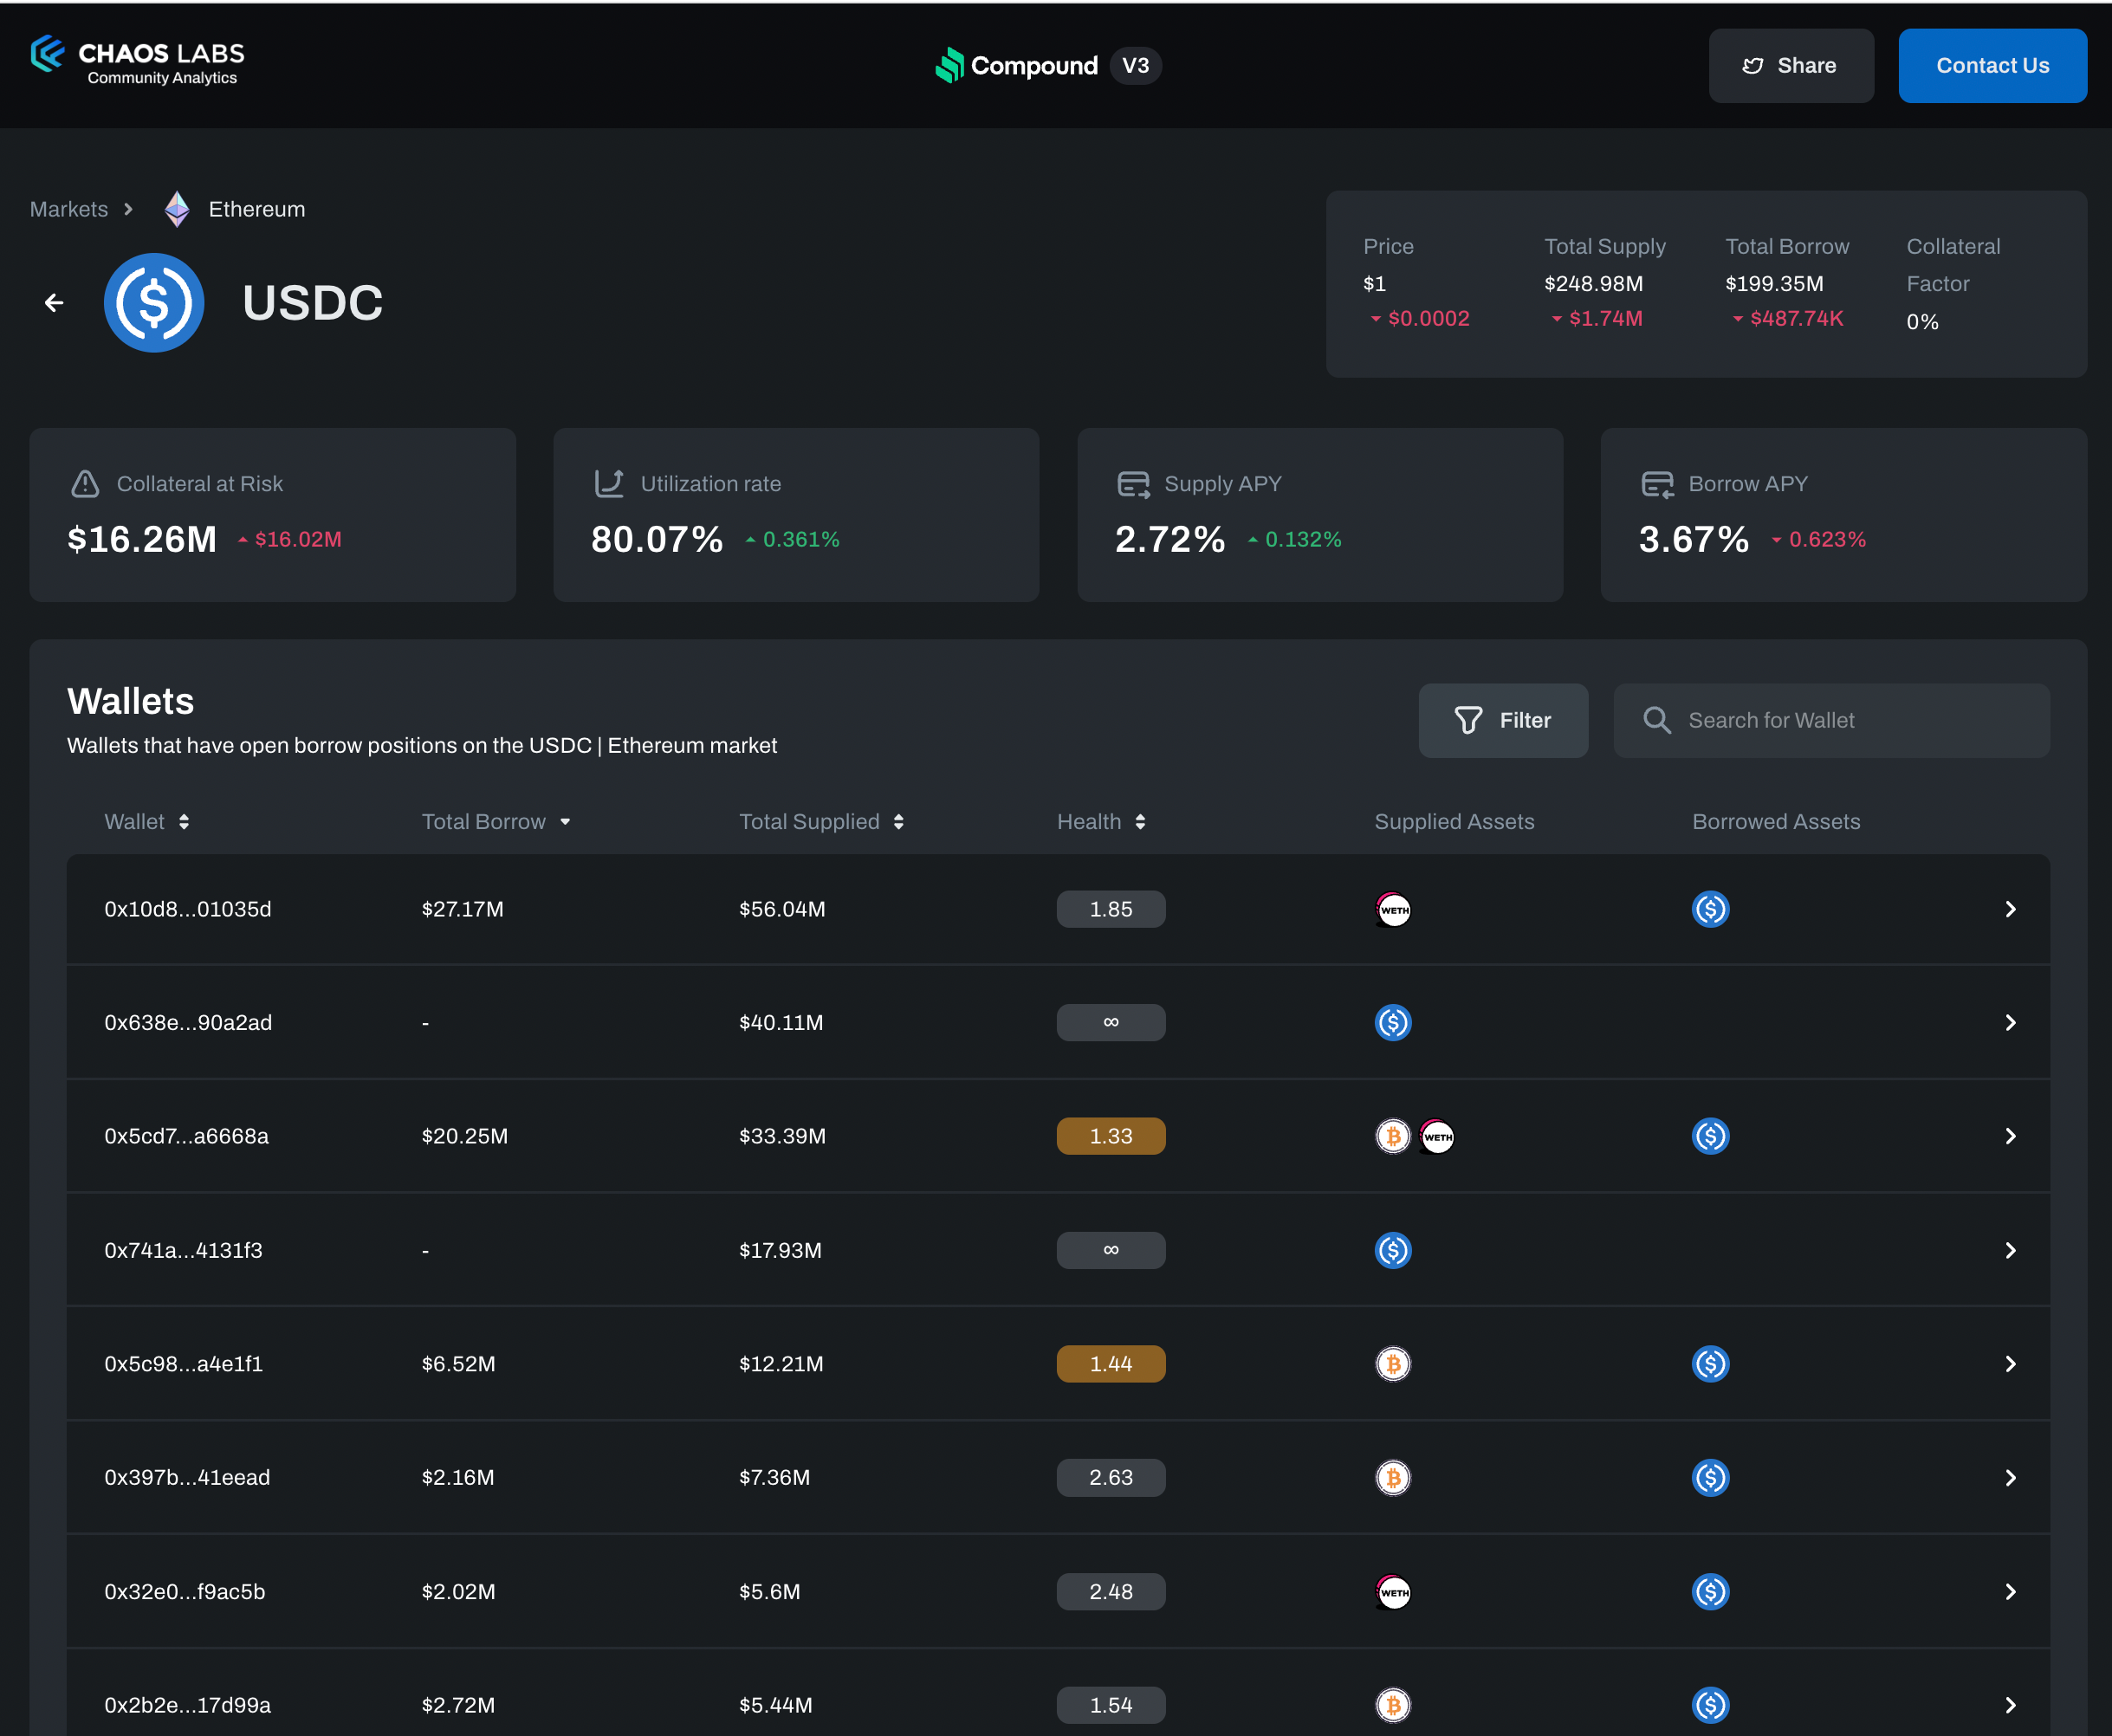
Clicking on any borrow market in this table opens the Market Detail view. This page consolidates all information about the market, including the borrow asset price, borrow and supply status, APYs, and collateral at risk - all with their 24h trend to surface changes. The detailed view allows users to observe and search for any wallet holding the asset. This is useful for drilling deep into accounts to see how they interact with Compound.
Total Supply and Borrow

The Total Supply and Total Borrow charts show the amount of supply (earning) and borrowing of the borrowed assets over time.
Borrowers’ Market Health and Collateral At Risk
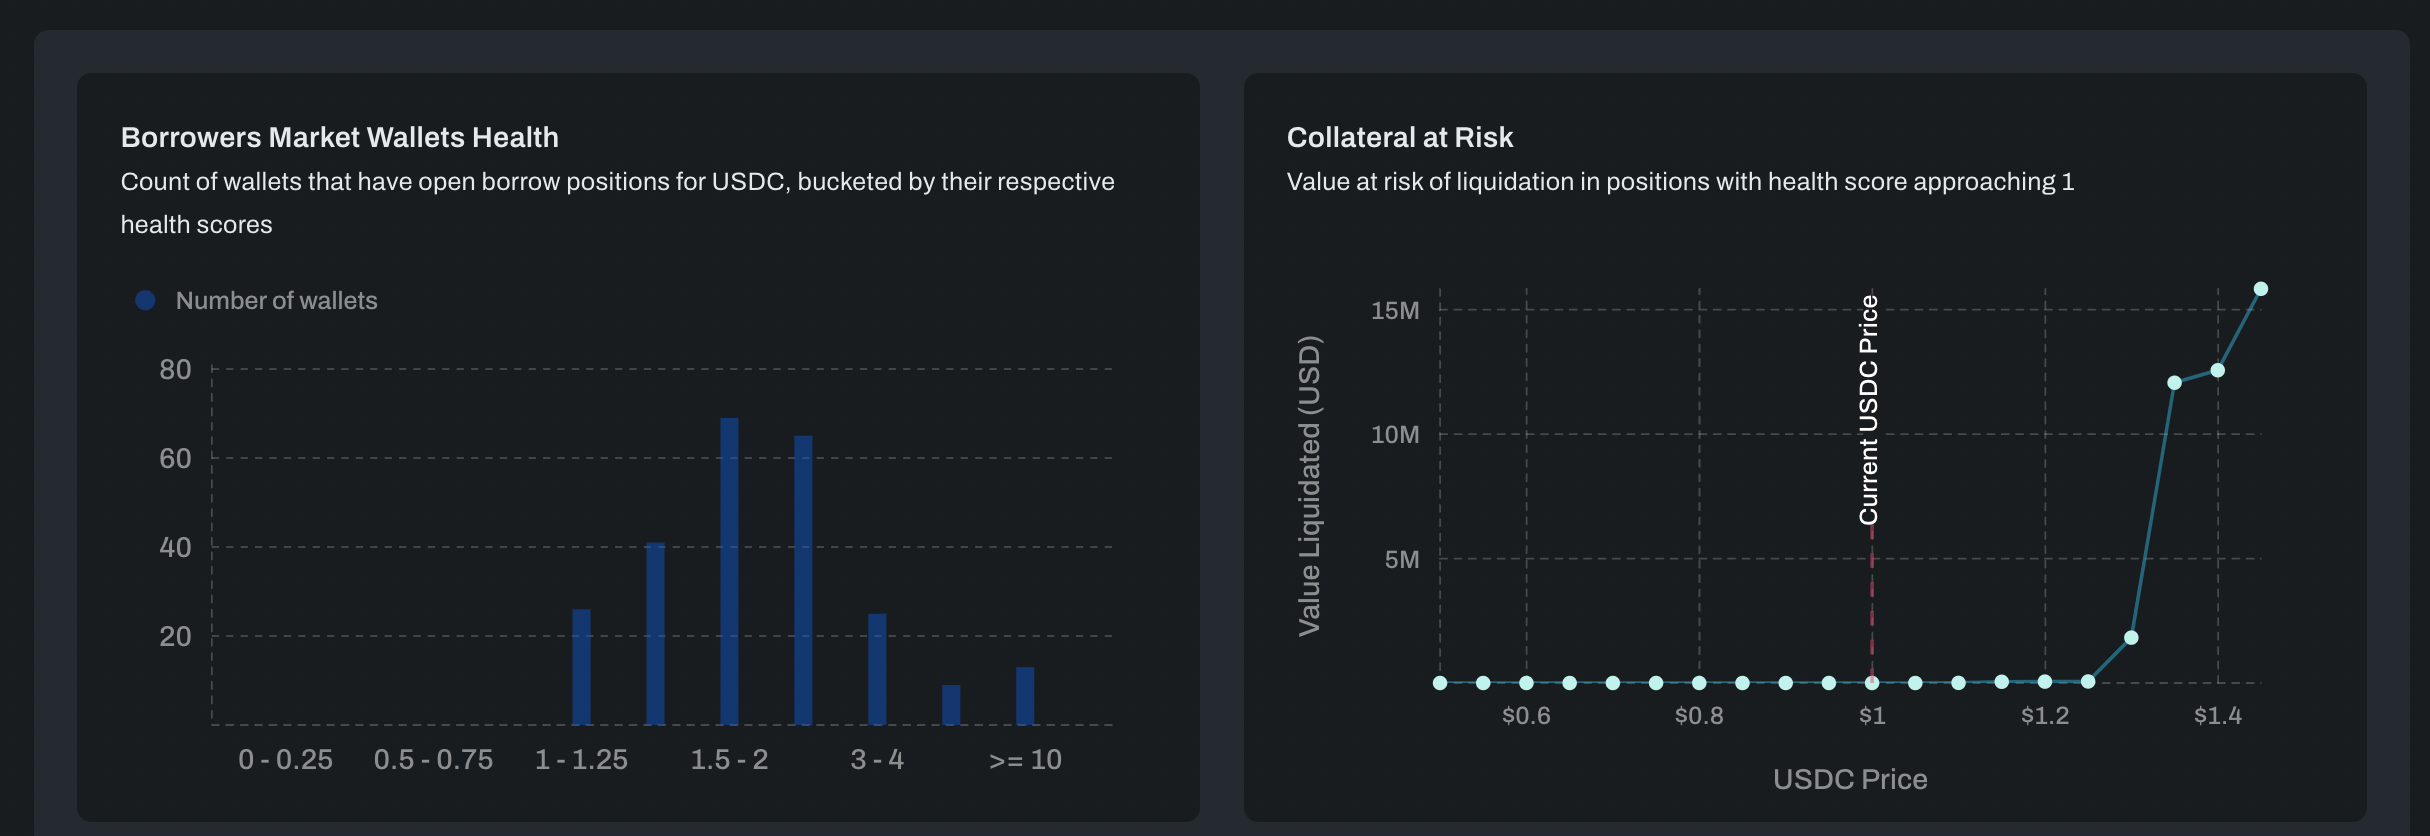
We can also see Collateral at Risk for the specified asset. This shows us the value to be liquidated (in USD) if prices deviate up or down. We can also observe a histogram of borrowers’ health, bucketed by their respective health scores.
Backing Collateral Distribution

The Backing Collateral Distribution over time chart shows what collateral this market uses. The chart can be toggled between USD amounts and relative percentages.
Recent Events
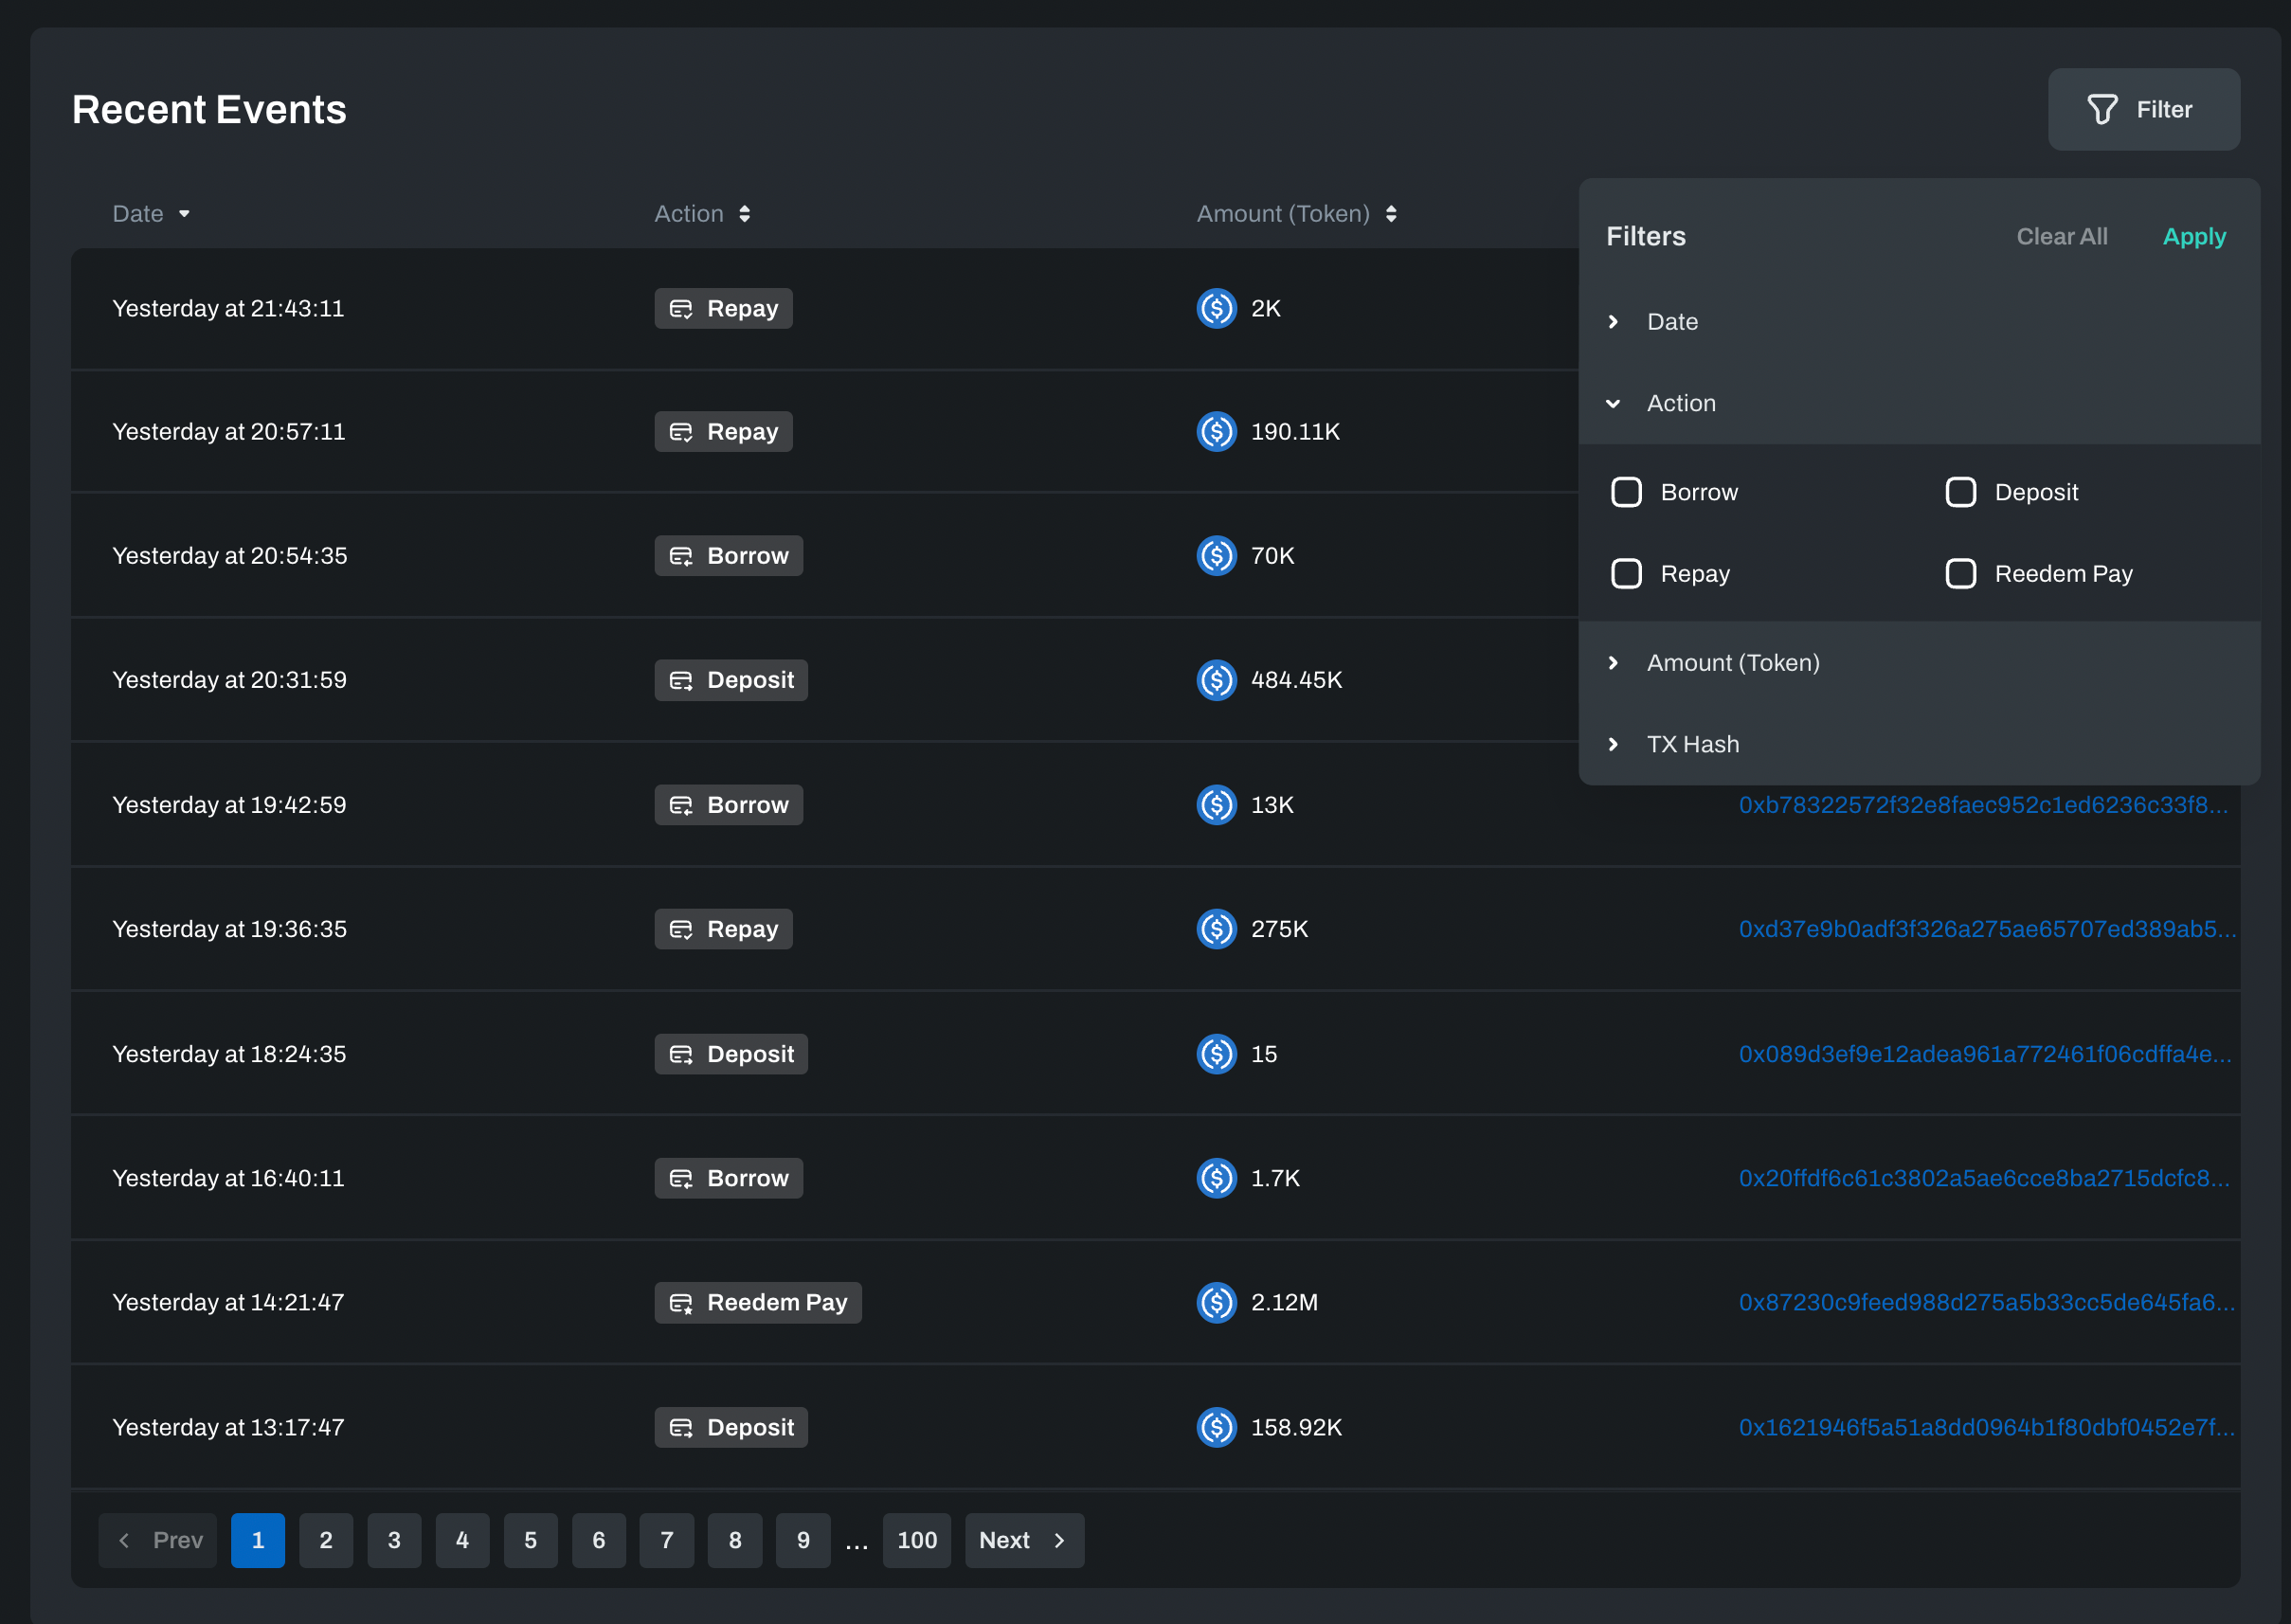
The Recent Events table consolidates all events that occurred in this market and can be filtered to show only specific event types.
Assets
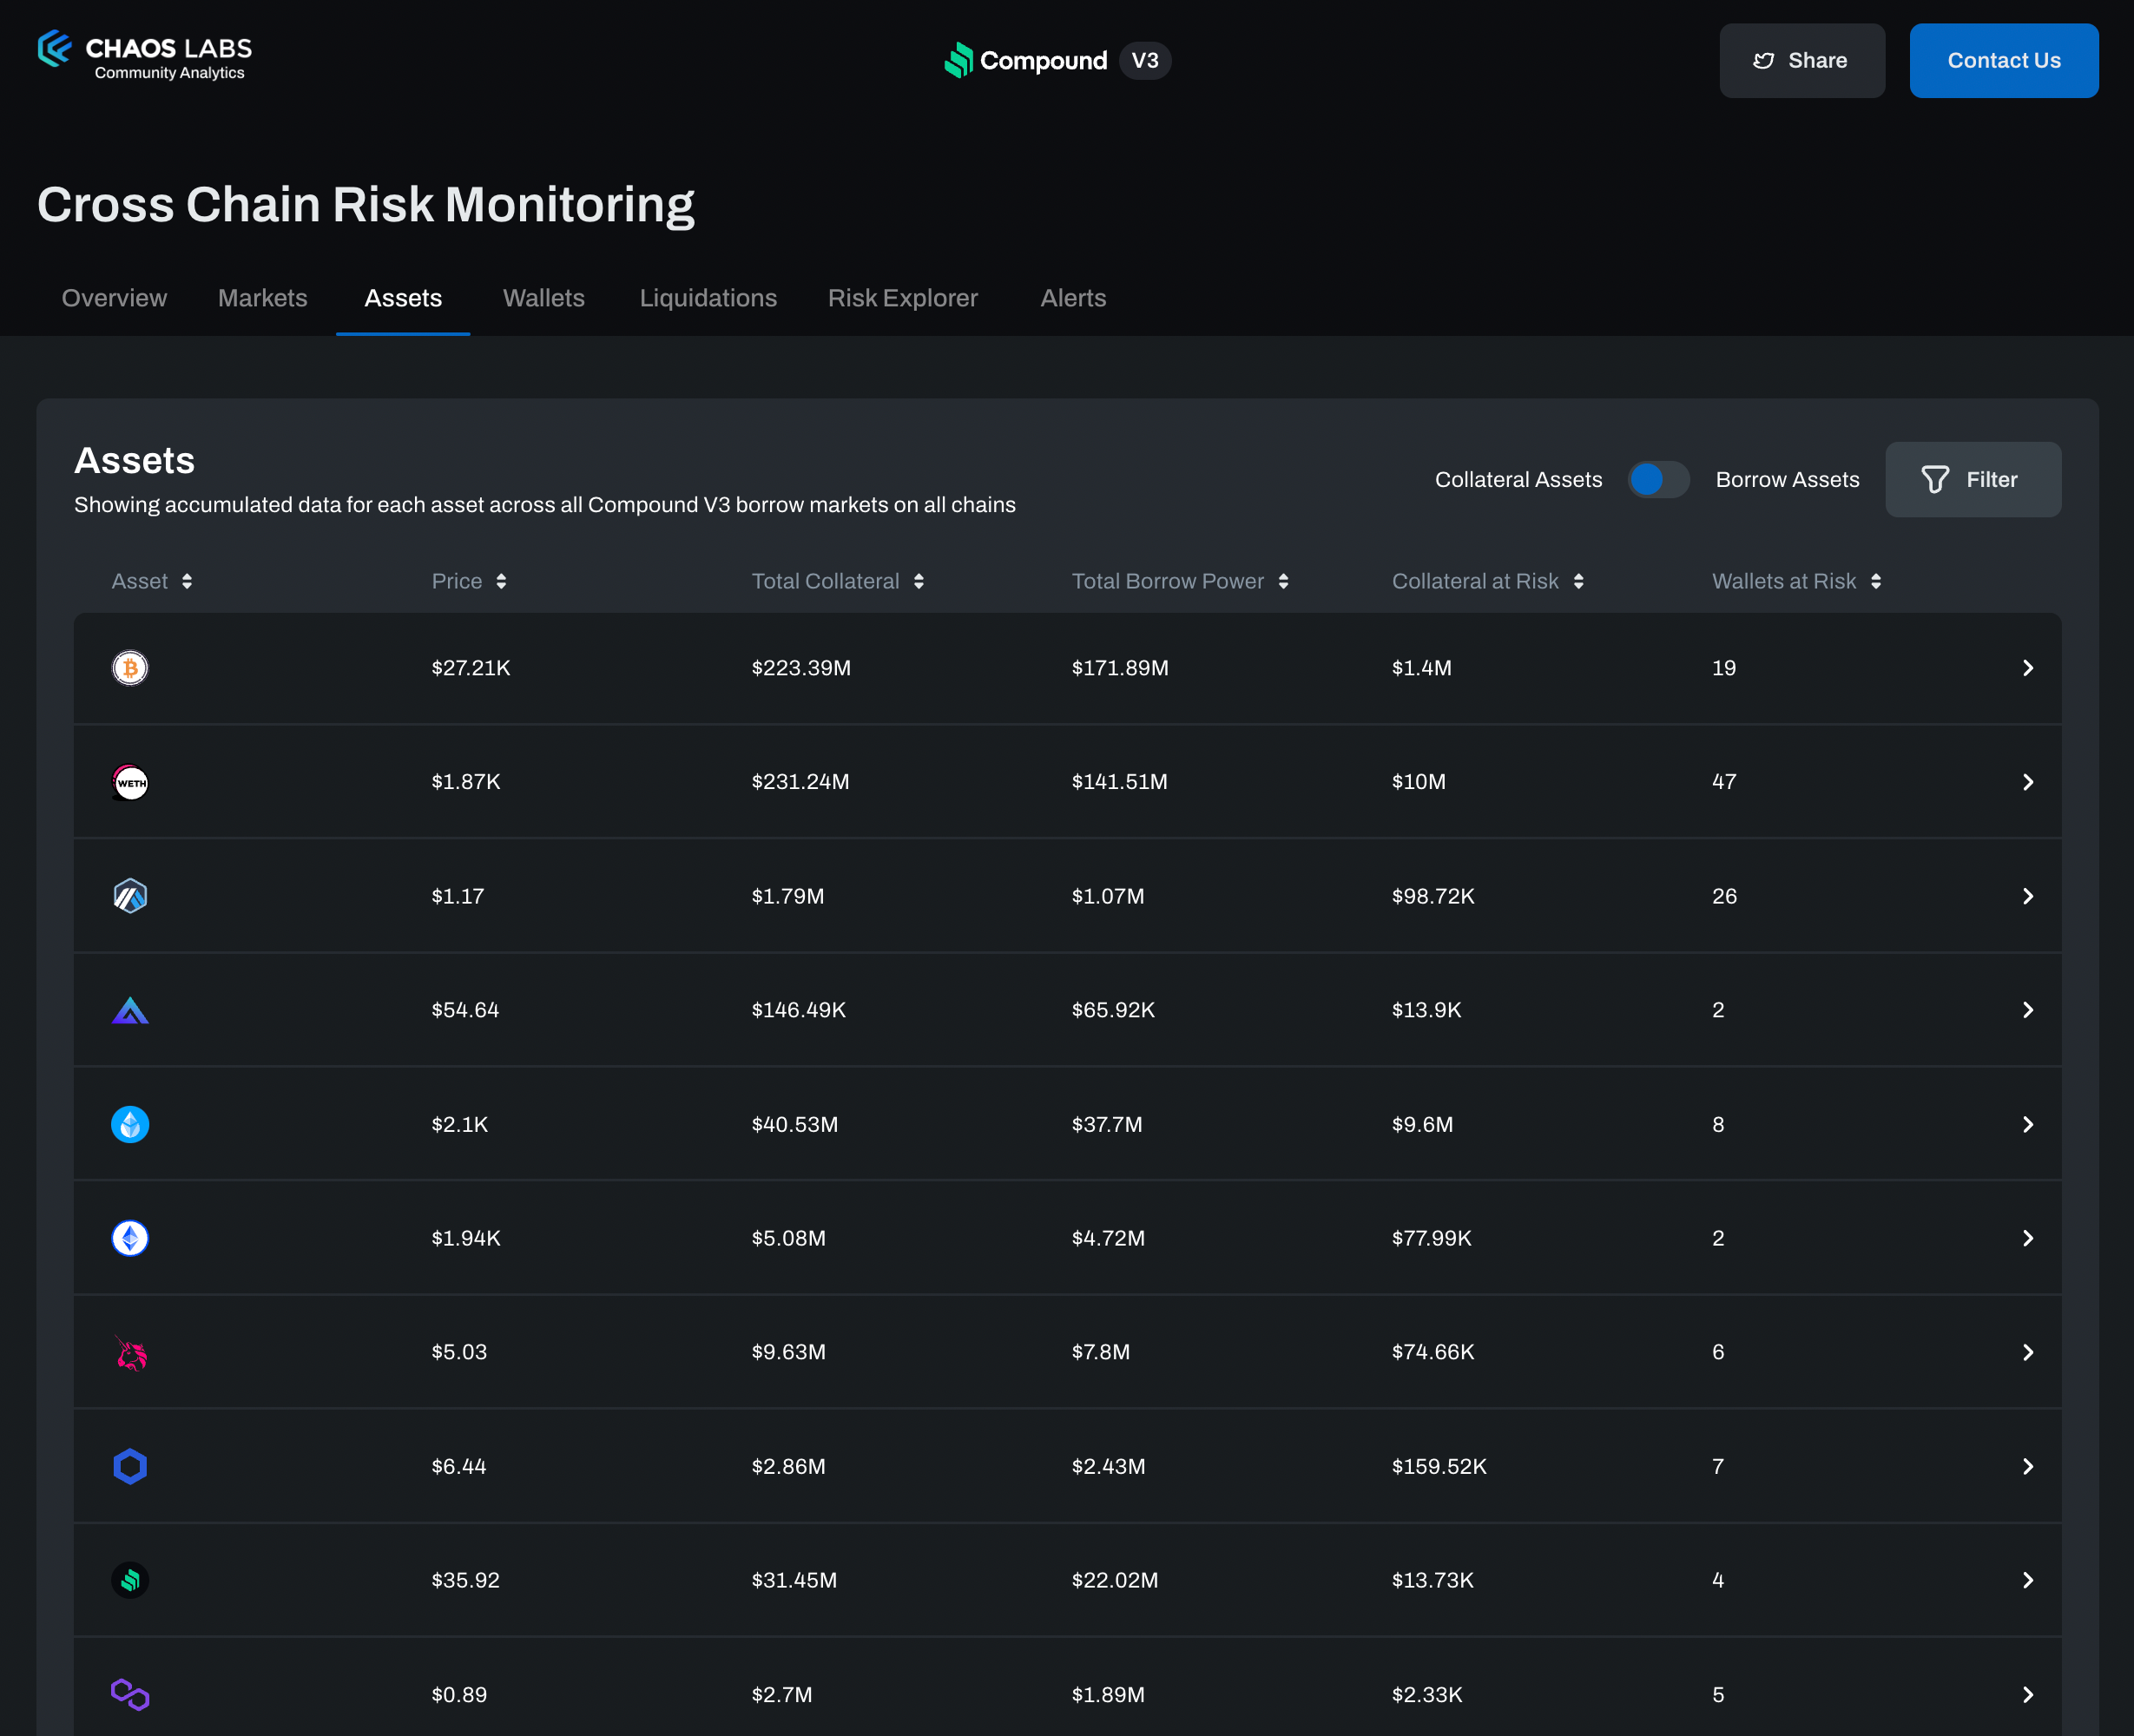
The Assets page shows aggregated details for each supply. It borrows assets across all markets and chains, enabling a detailed understanding of the protocol exposure to any asset across all chains. Specifically, the Collateral at Risk and Wallets at Risk columns aggregate data from positions with low health values that are approaching liquidations across all chains to provide a clear view of liquidations at risk in case of asset price change.
Asset
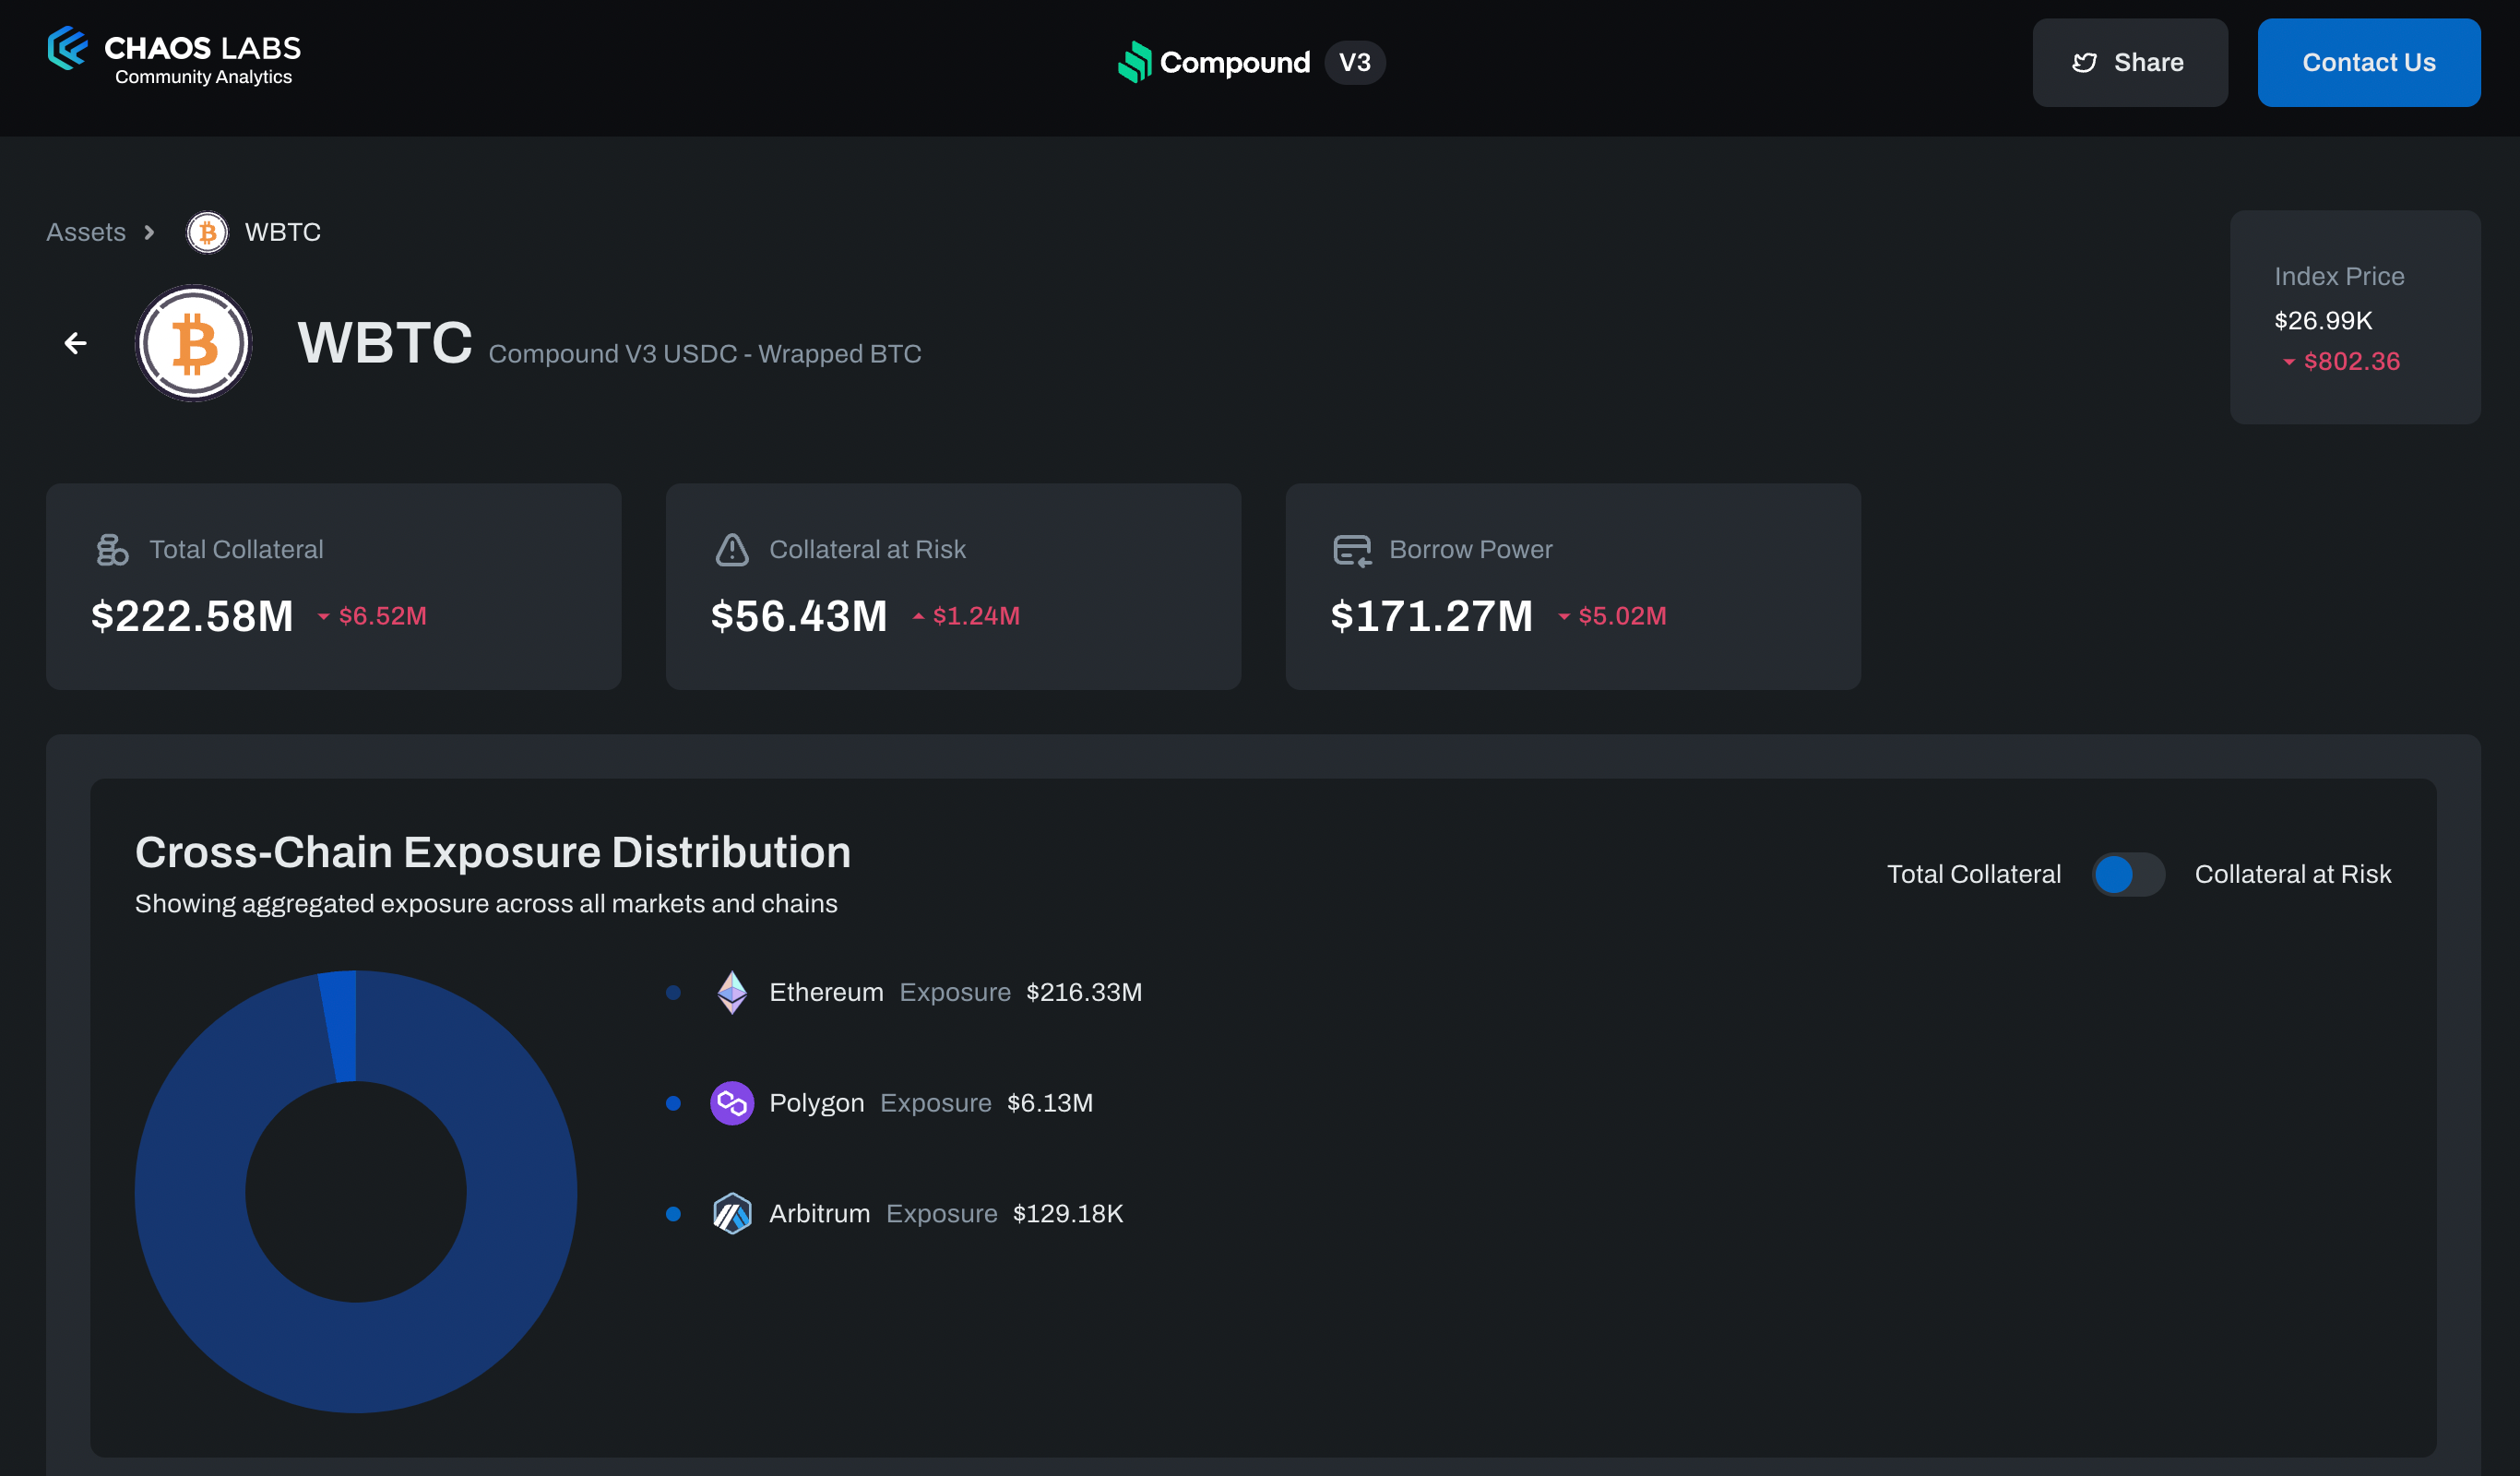
Clicking on any asset in the Assets table open the asset detail page, aggregating data for the specific asset across all markets and chains, including the per-chain breakdown of exposure to this asset, that can be toggled between all collateral and collateral at risk. A Cross Chain exposure over time chart shows the historical trend of the protocol exposure to this asset, broken down by a chain.
Cross-Chain Exposure Chart

Details Compound V3's exposure to assets across all deployments.
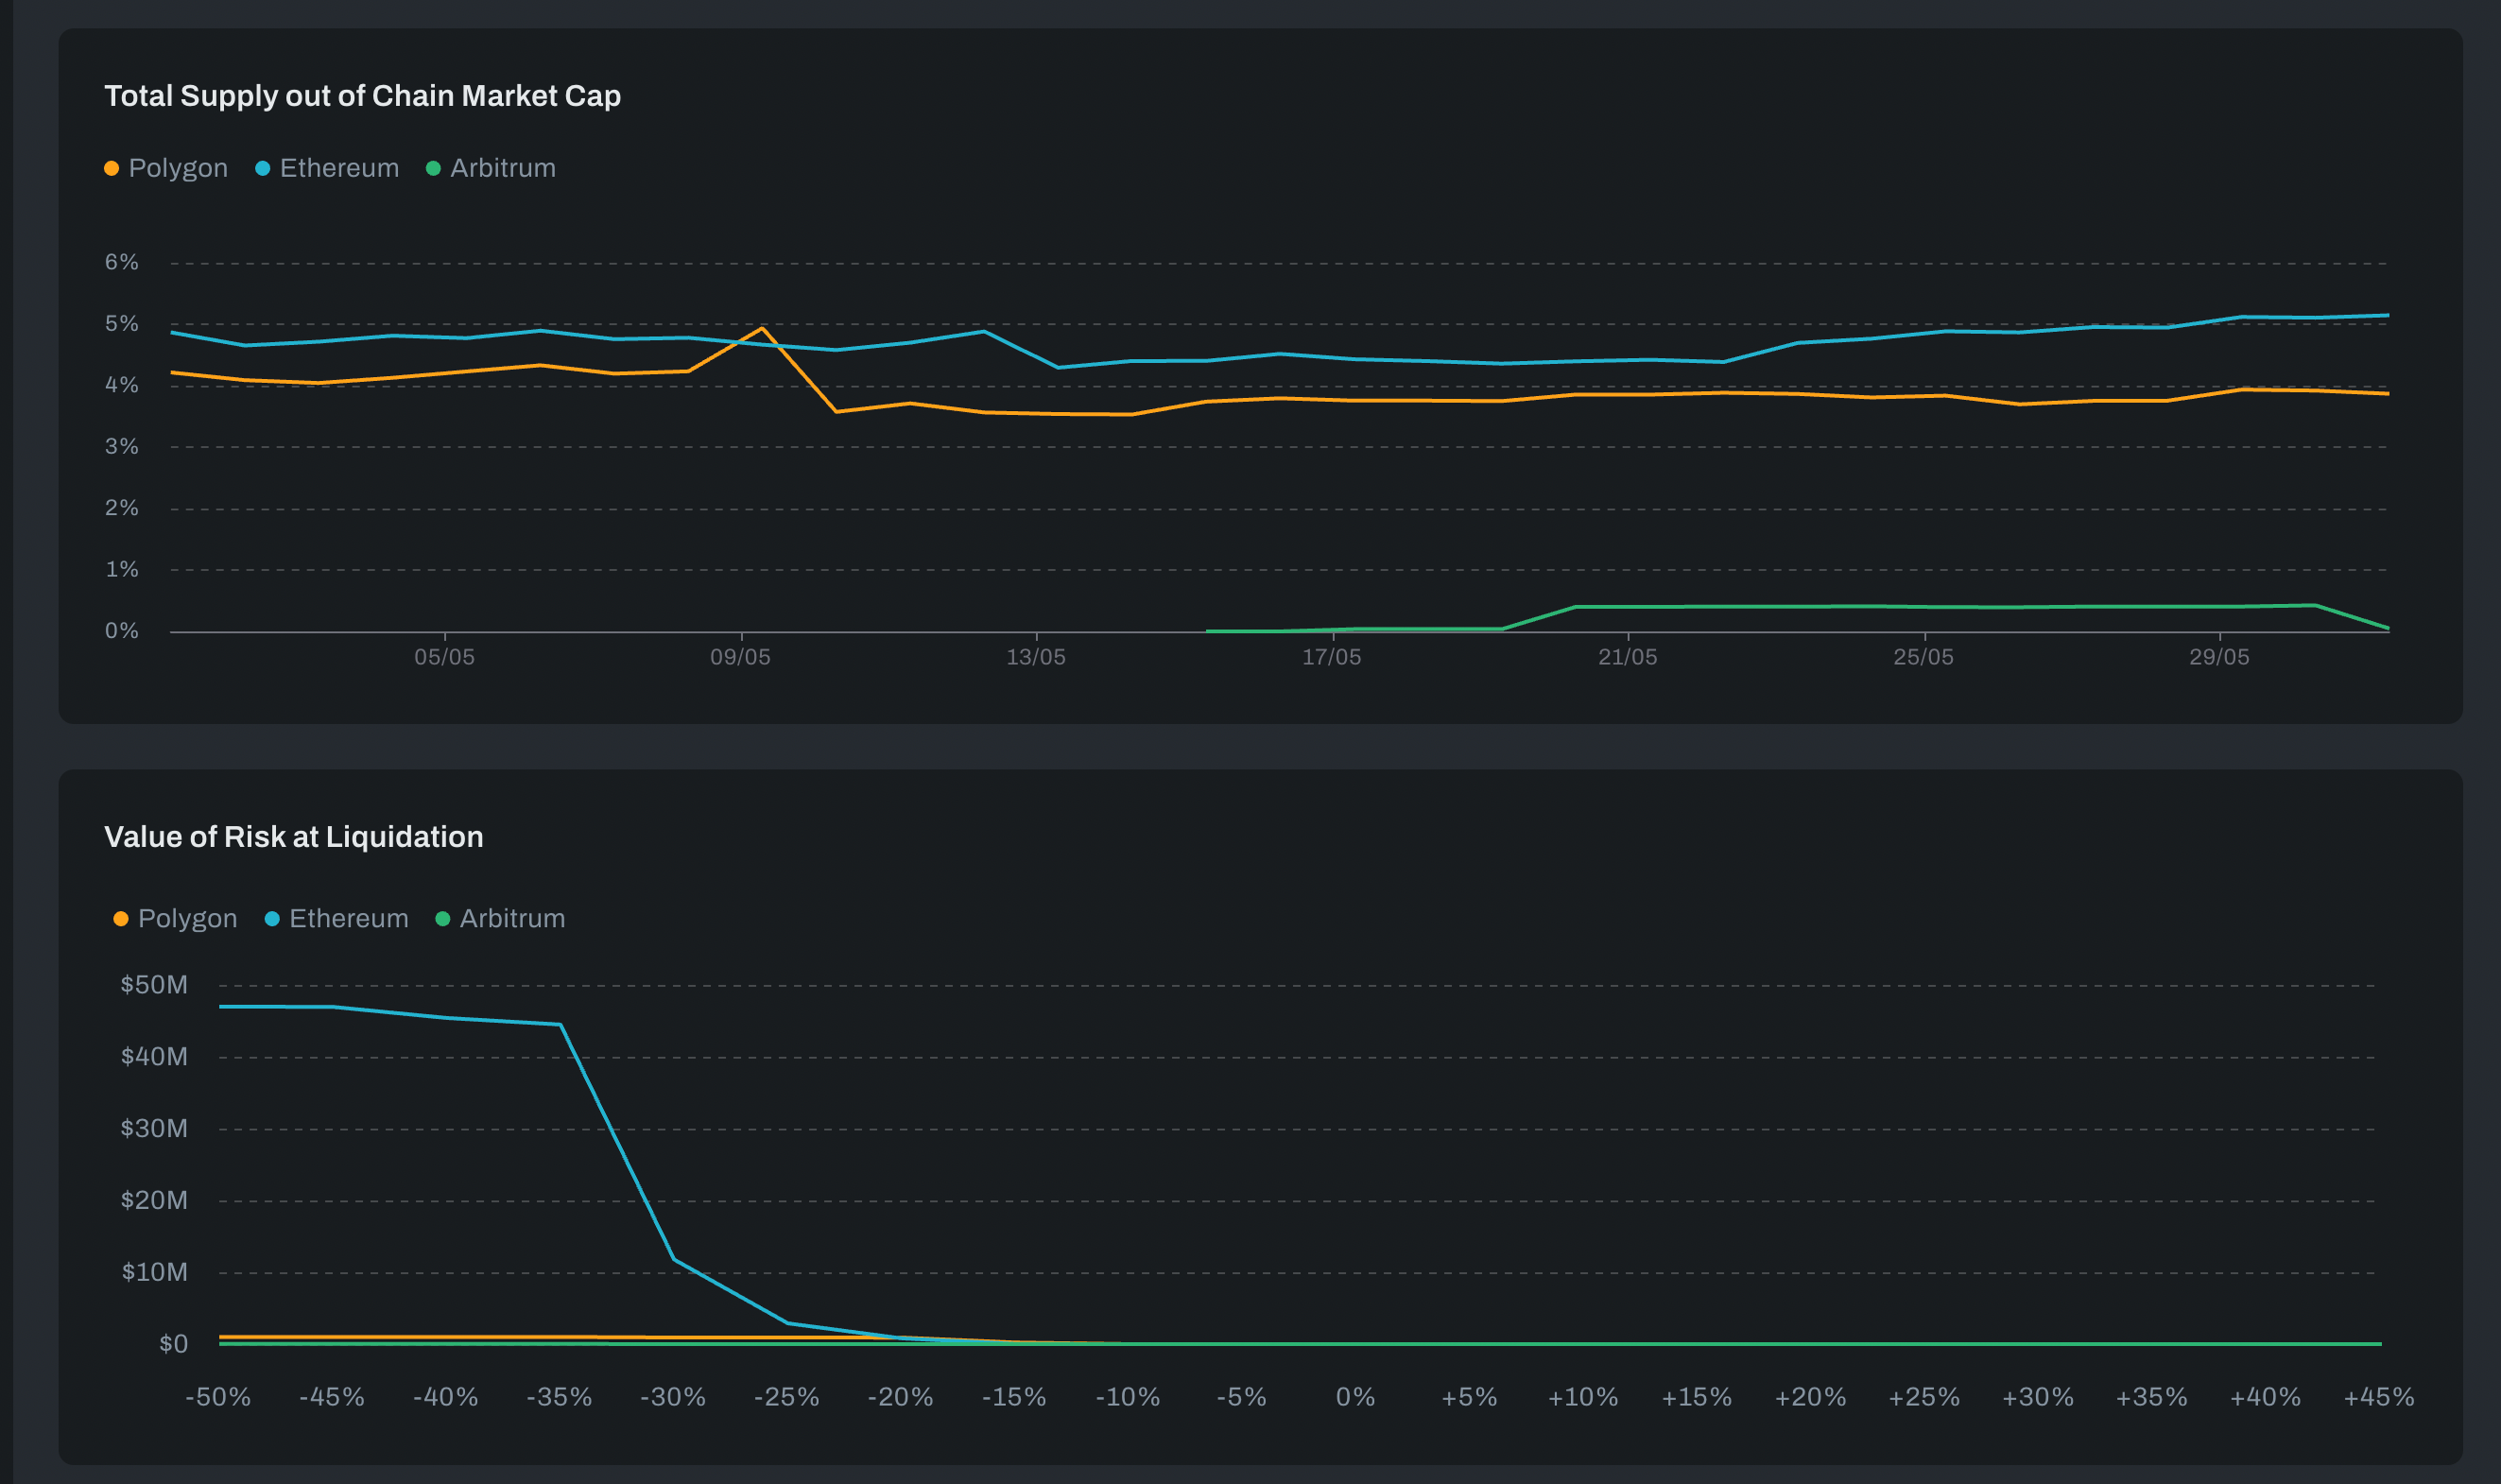
The asset detail page also shows the percentage of asset market cap that is on Compound V3 across each chain, as well as an indication of the amount of collateral that will be liquidated at different price points on each chain.
Wallets
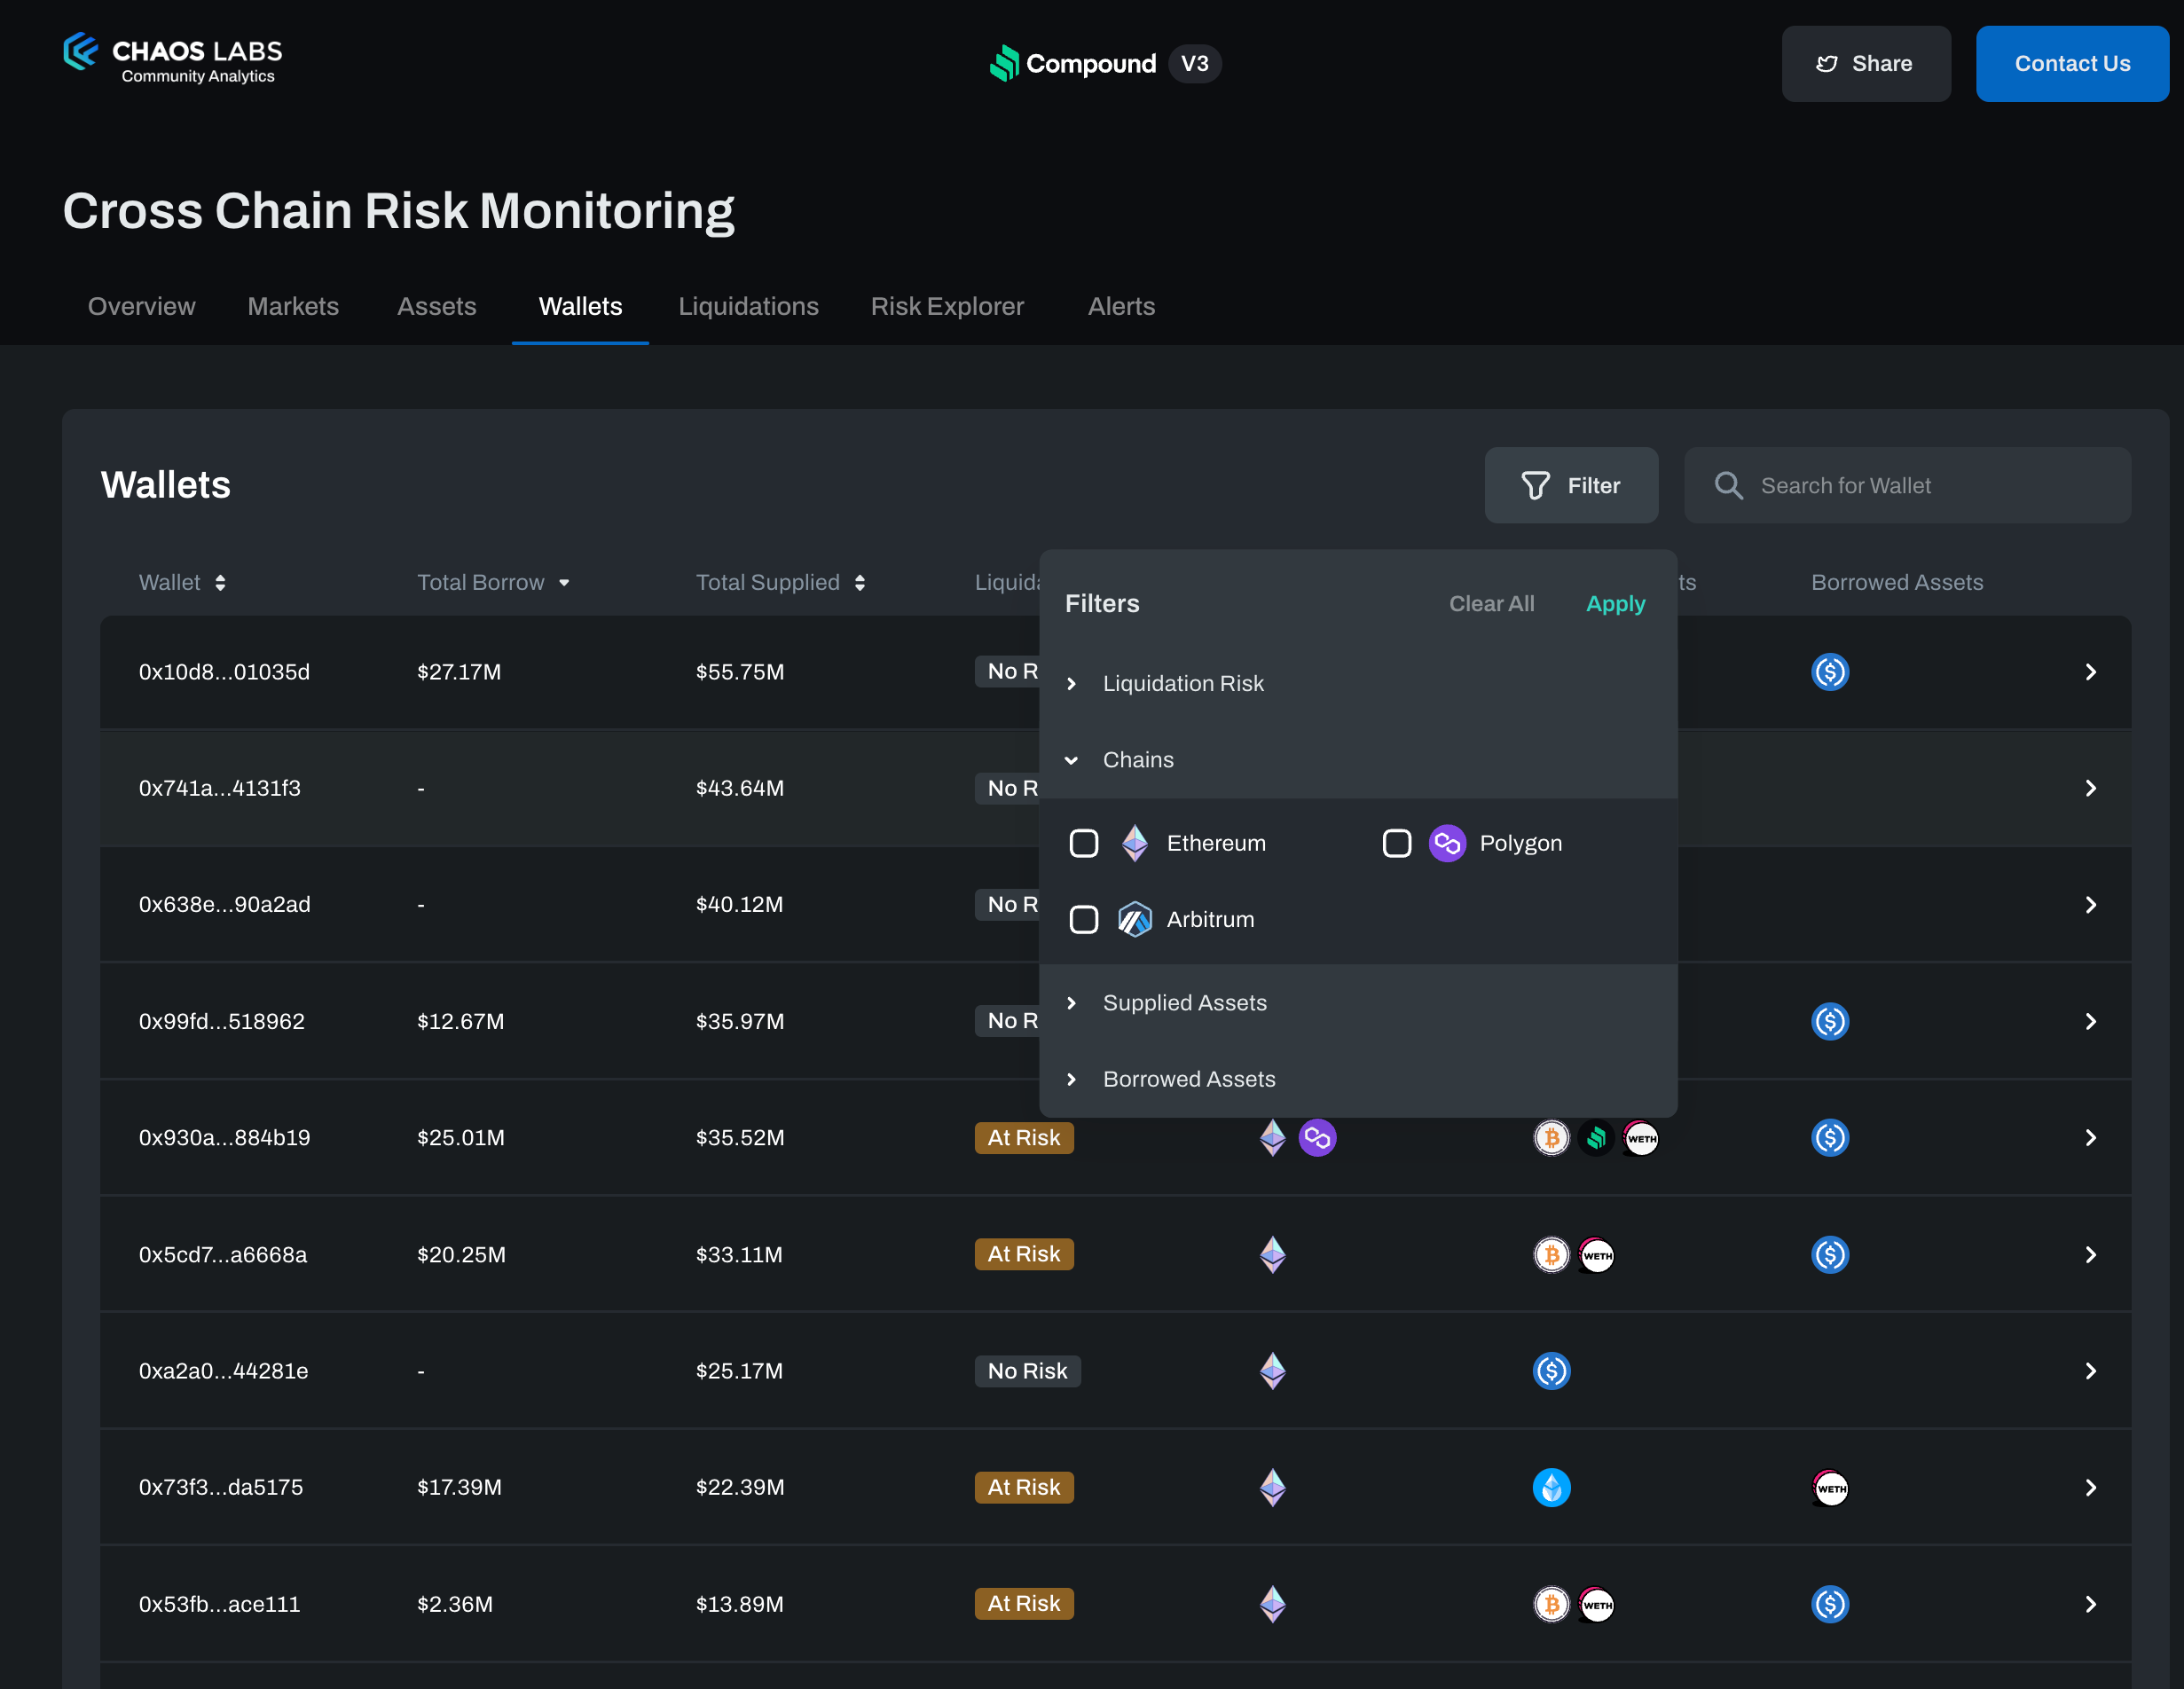
The wallets page presents a comprehensive table that showcases all positions within the Compound V3 protocol. Users can conveniently search for specific wallet addresses or leverage the advanced filtering functionality that enables filtering wallets by liquidation risk level, chain, supply, or borrow assets.
Wallet Detail
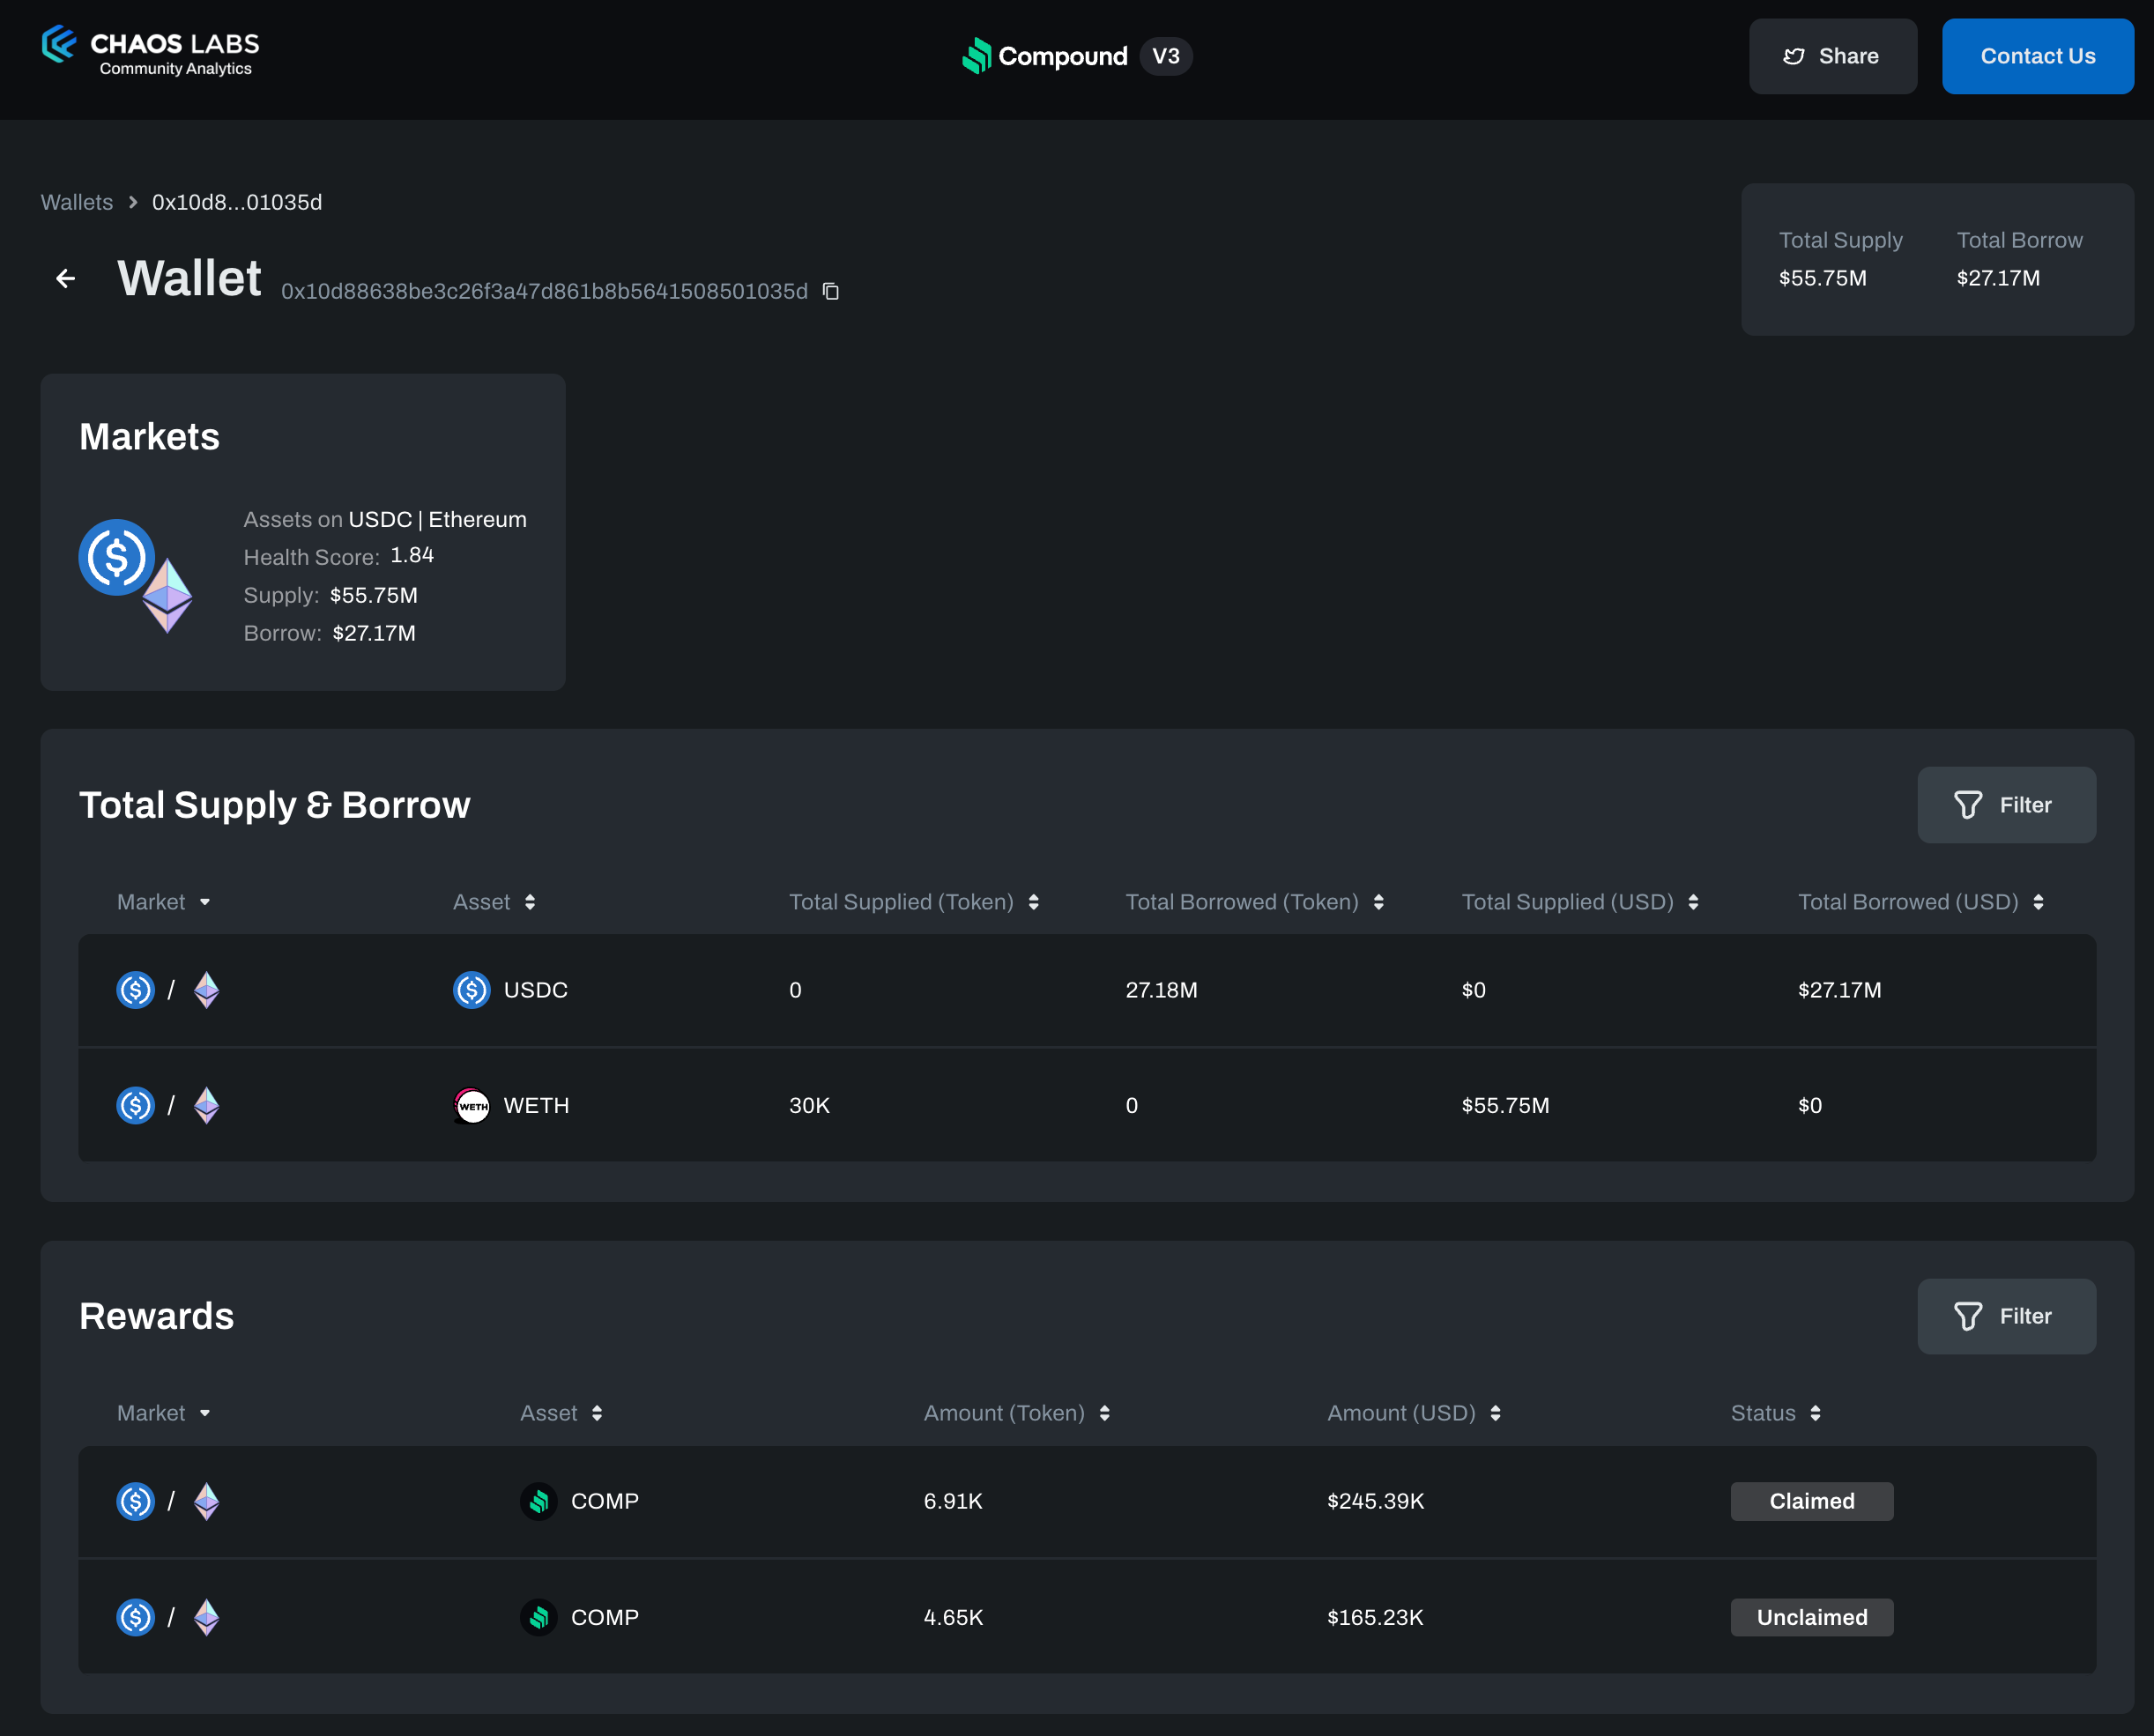
By selecting a specific row in the wallets page, users will be directed to the wallet detail page, which displays all supply and borrows positions for this account across all chains and borrows markets. Additionally, the wallet detail page shows reward tokens and recent events to get a detailed history for the selected wallet.
Liquidations
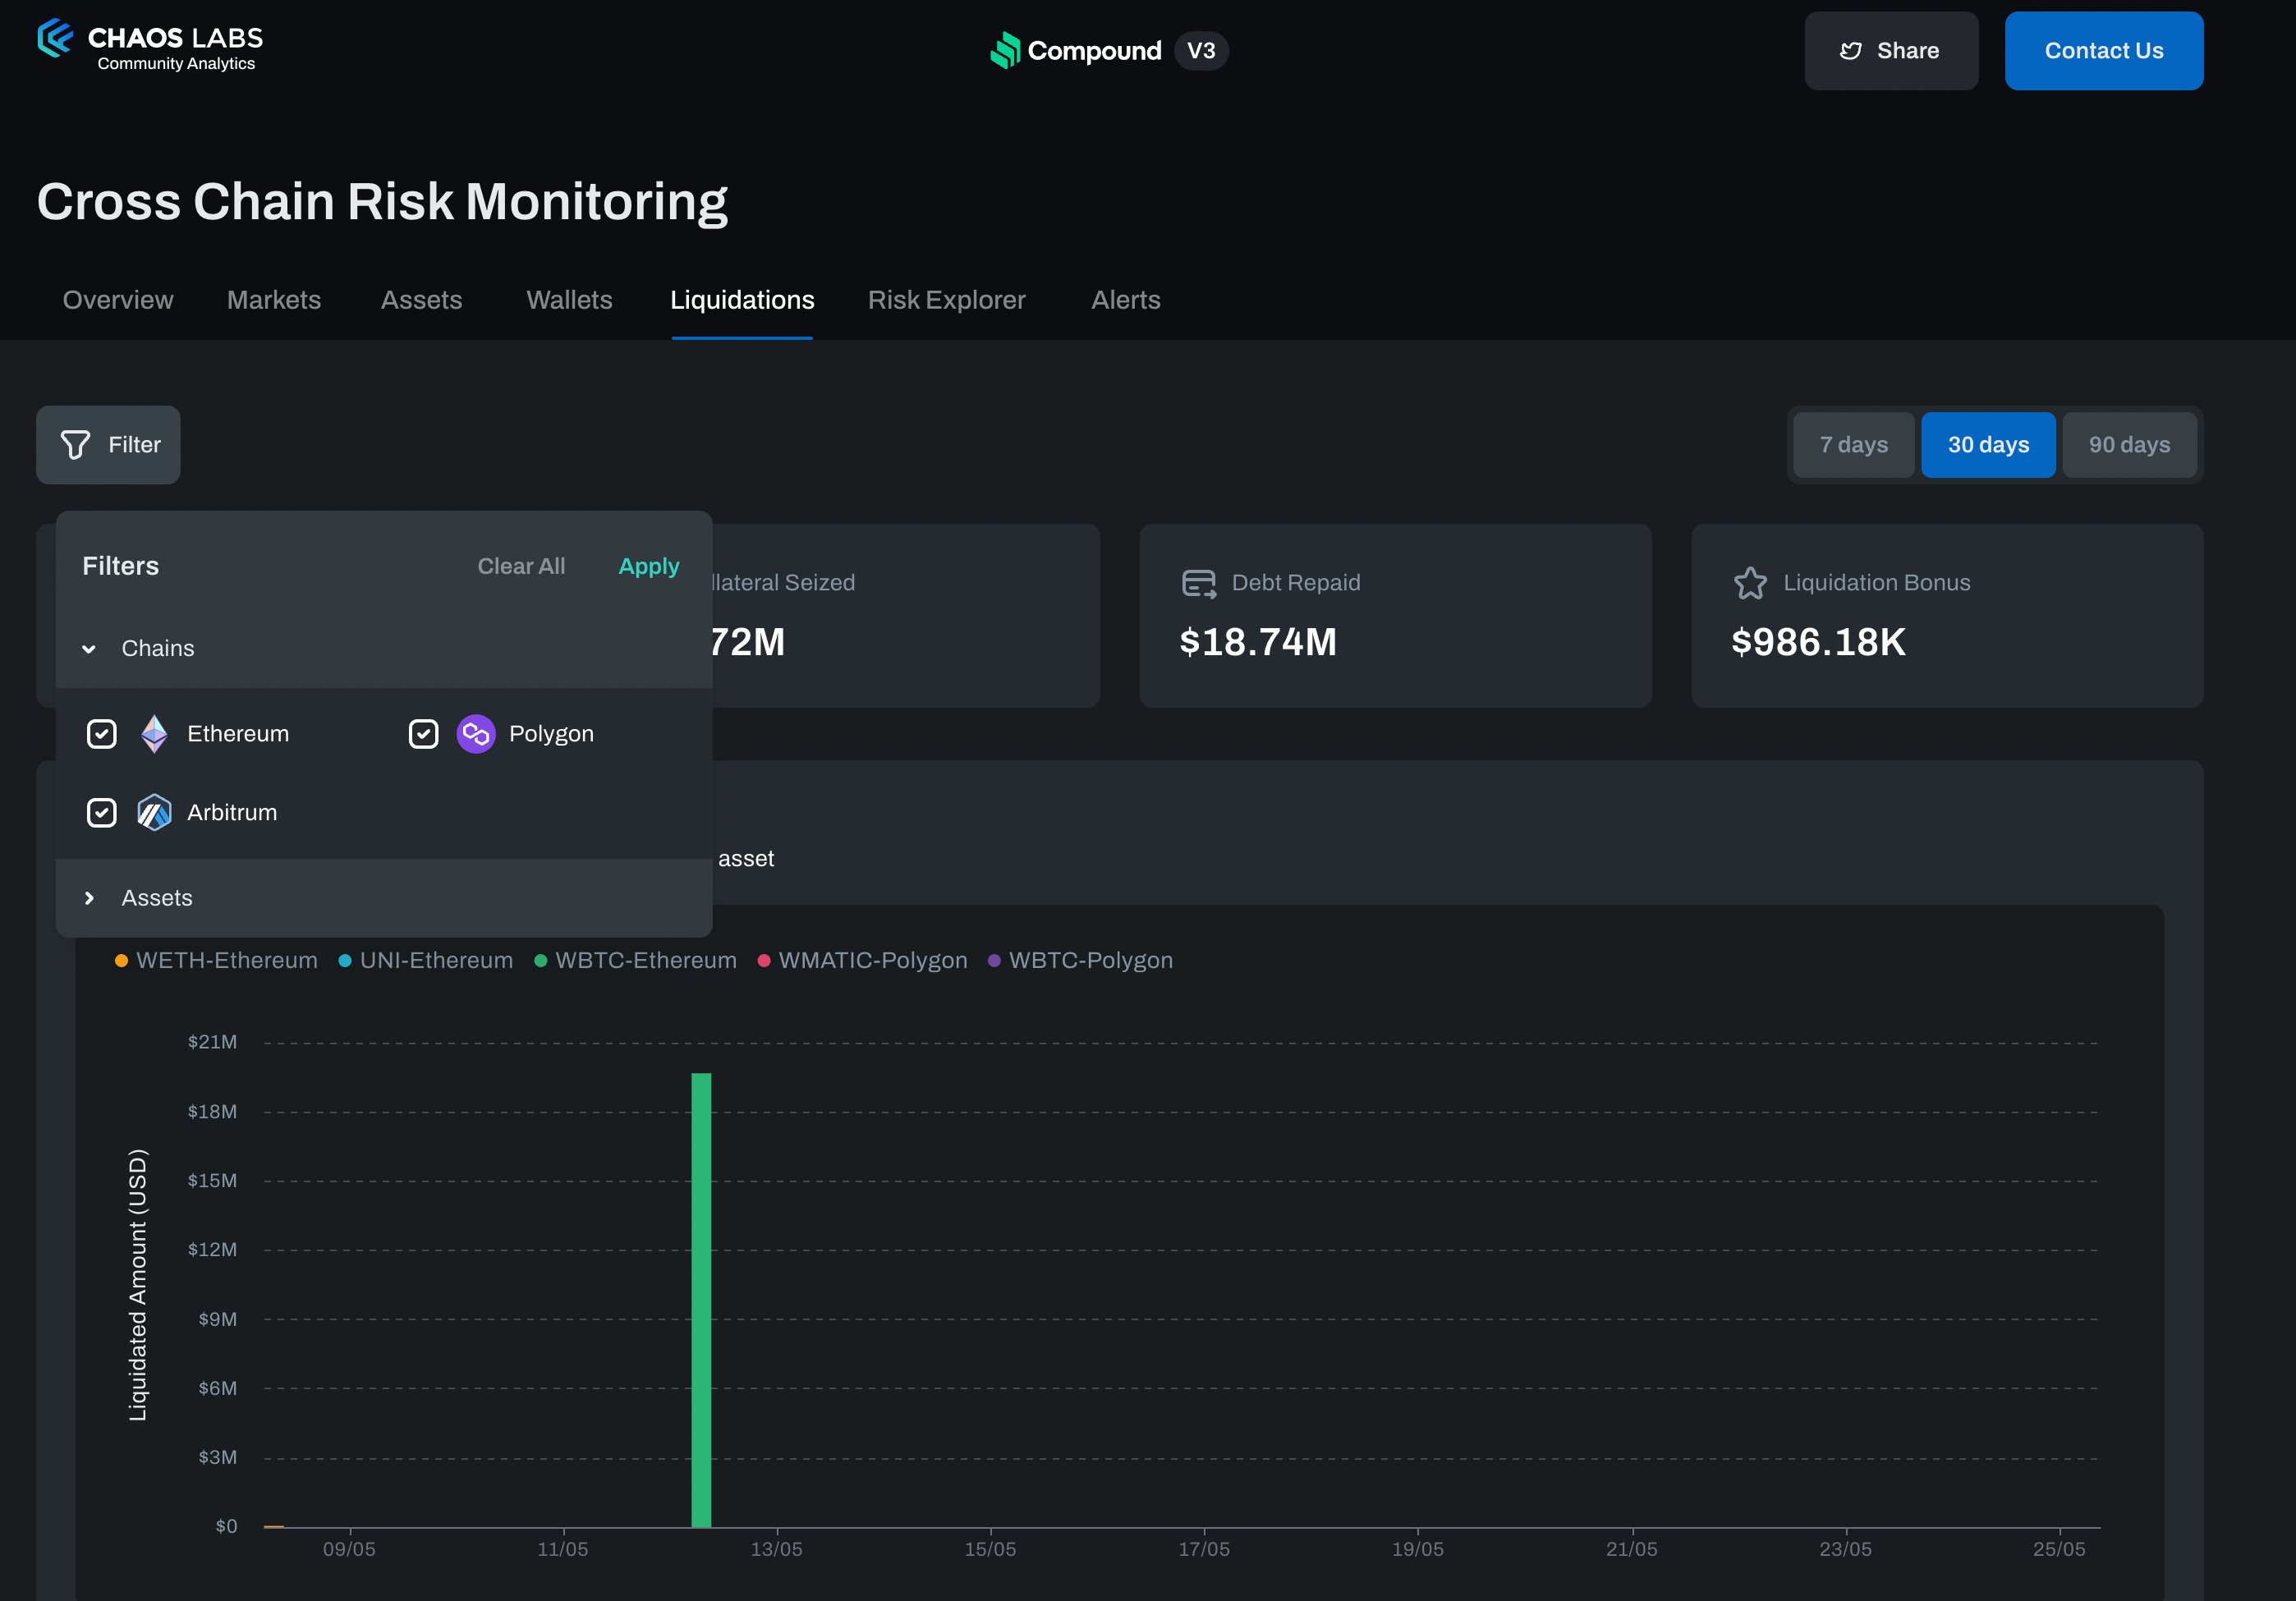
The liquidations page presents aggregated metadata on protocol liquidations from all chains and borrows markets, spanning 7, 30, and 90-day time frames. By default, data from all chains are displayed in aggregate. Users can filter and view results for specific chains or assets using the Filter button.
Recent Liquidation Events
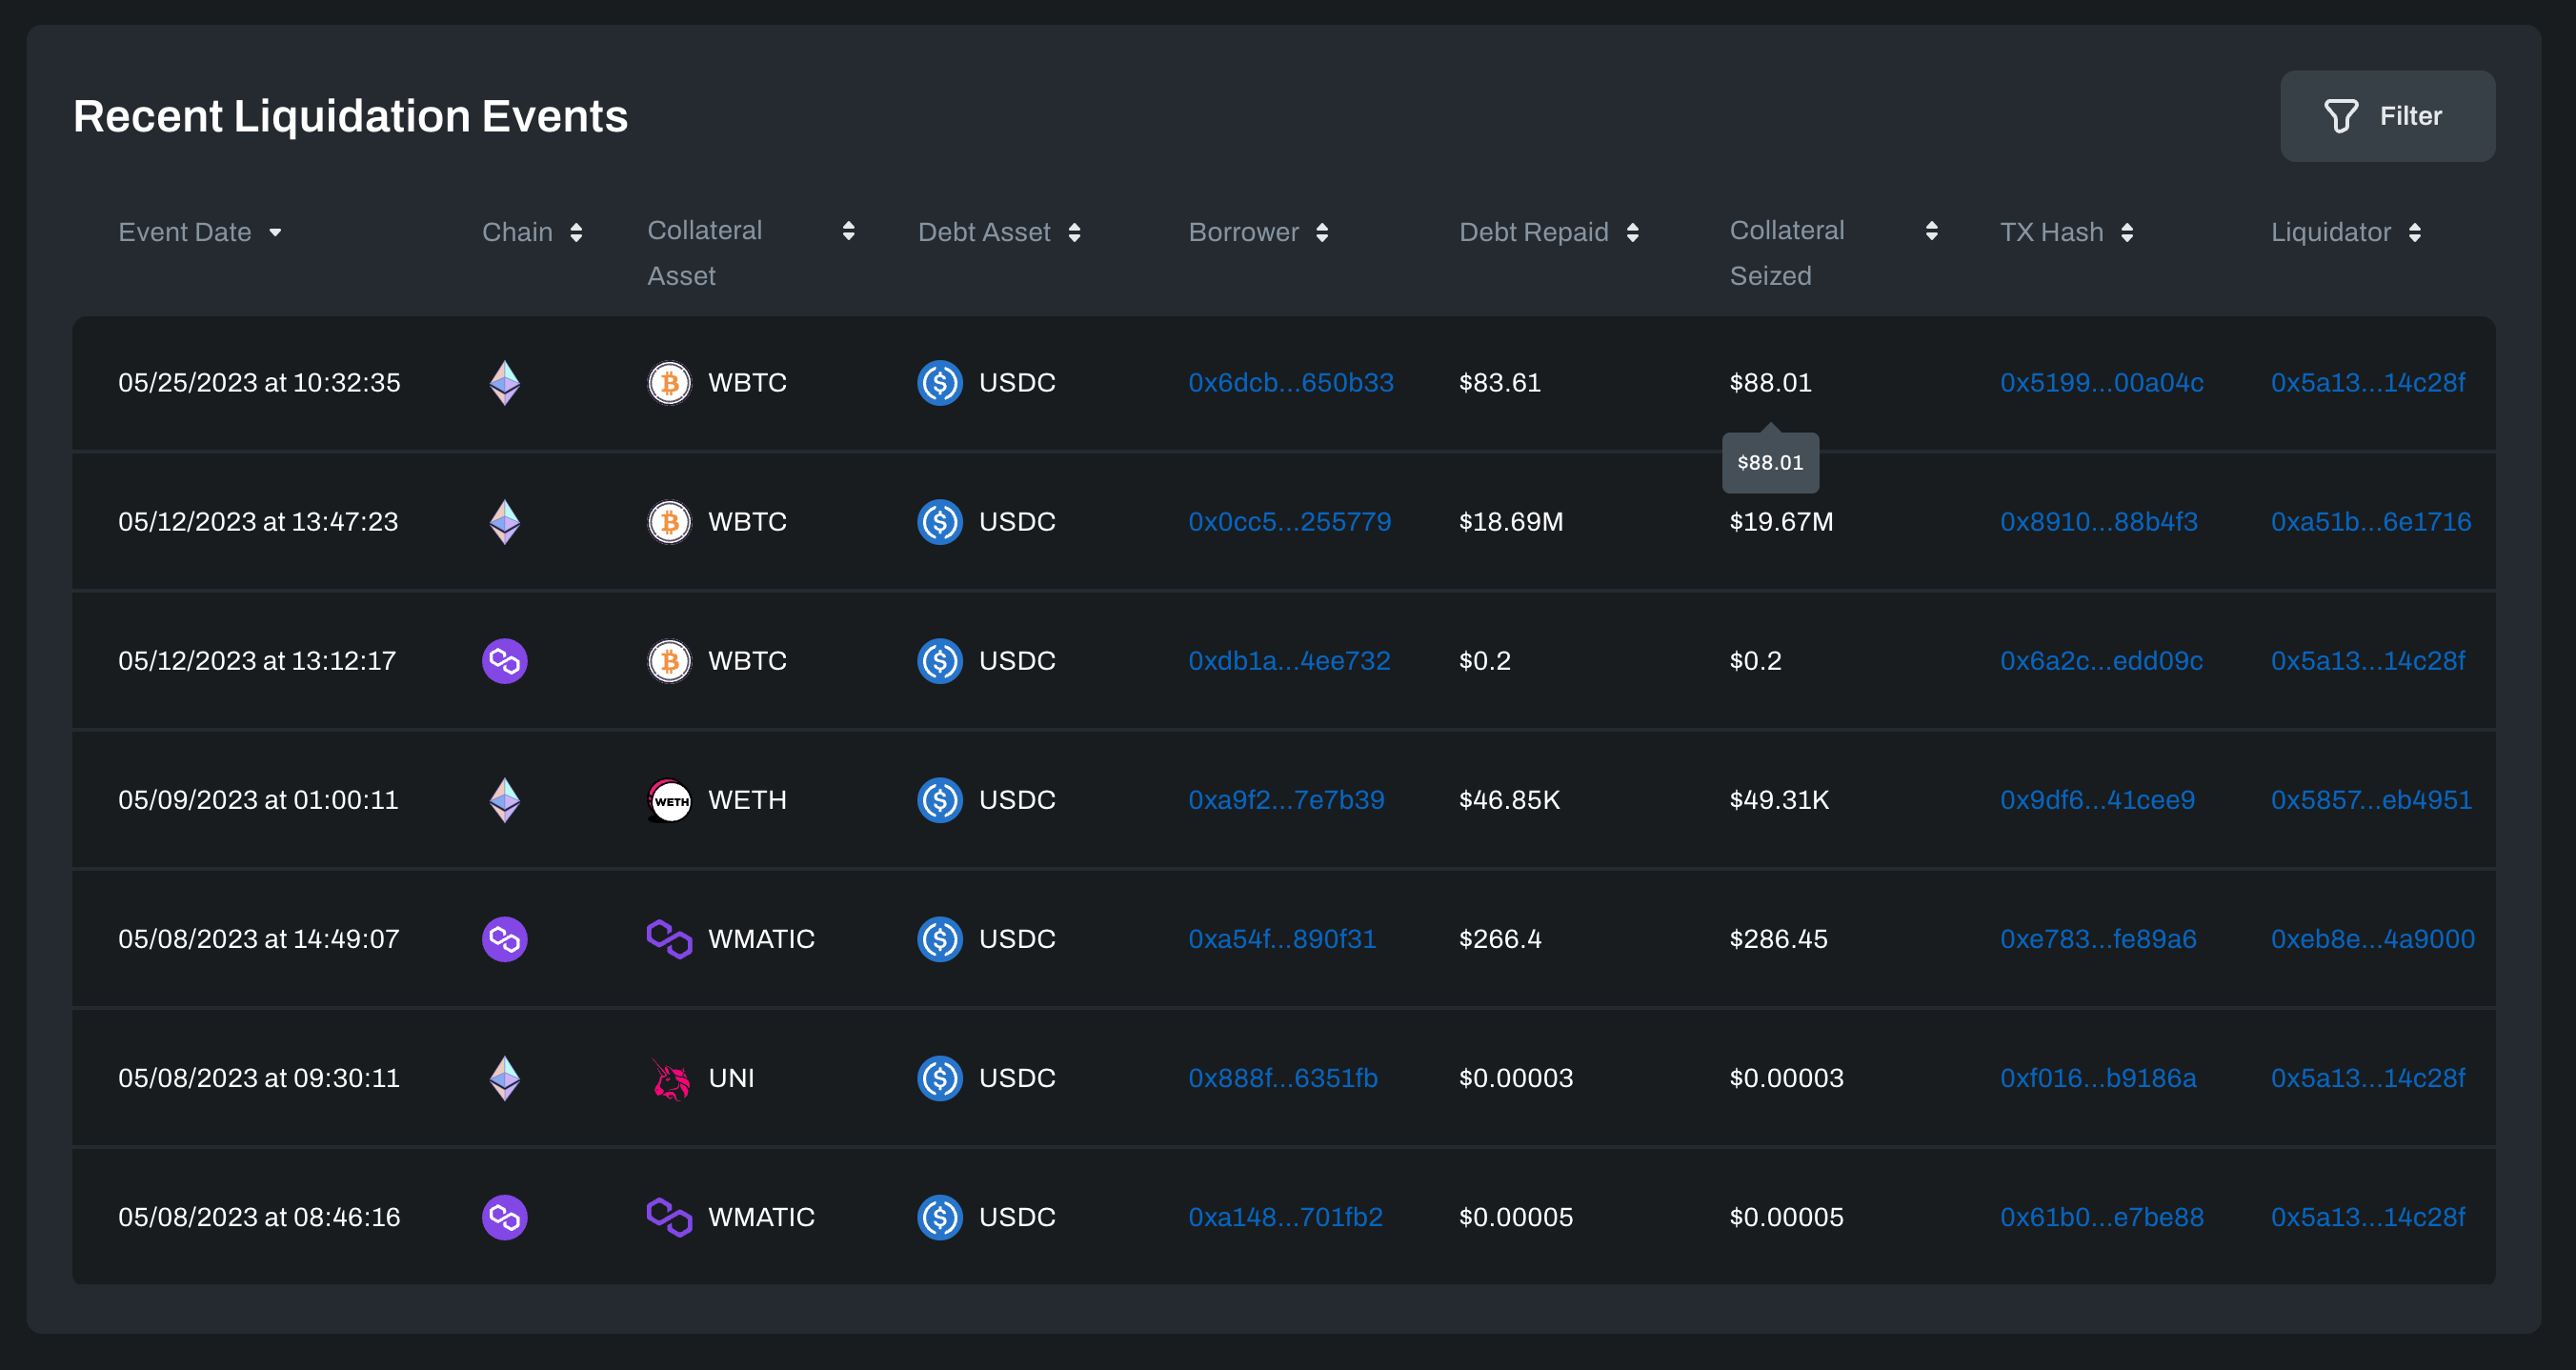
Moreover, the page offers a graphical representation of observed liquidation events on a daily basis, as well as a table that displays relevant liquidation events. Users can select a specific liquidation event, which will direct them to the Wallet Detail page of the corresponding account for a more detailed analysis.
Cross Chain Risk Explorer
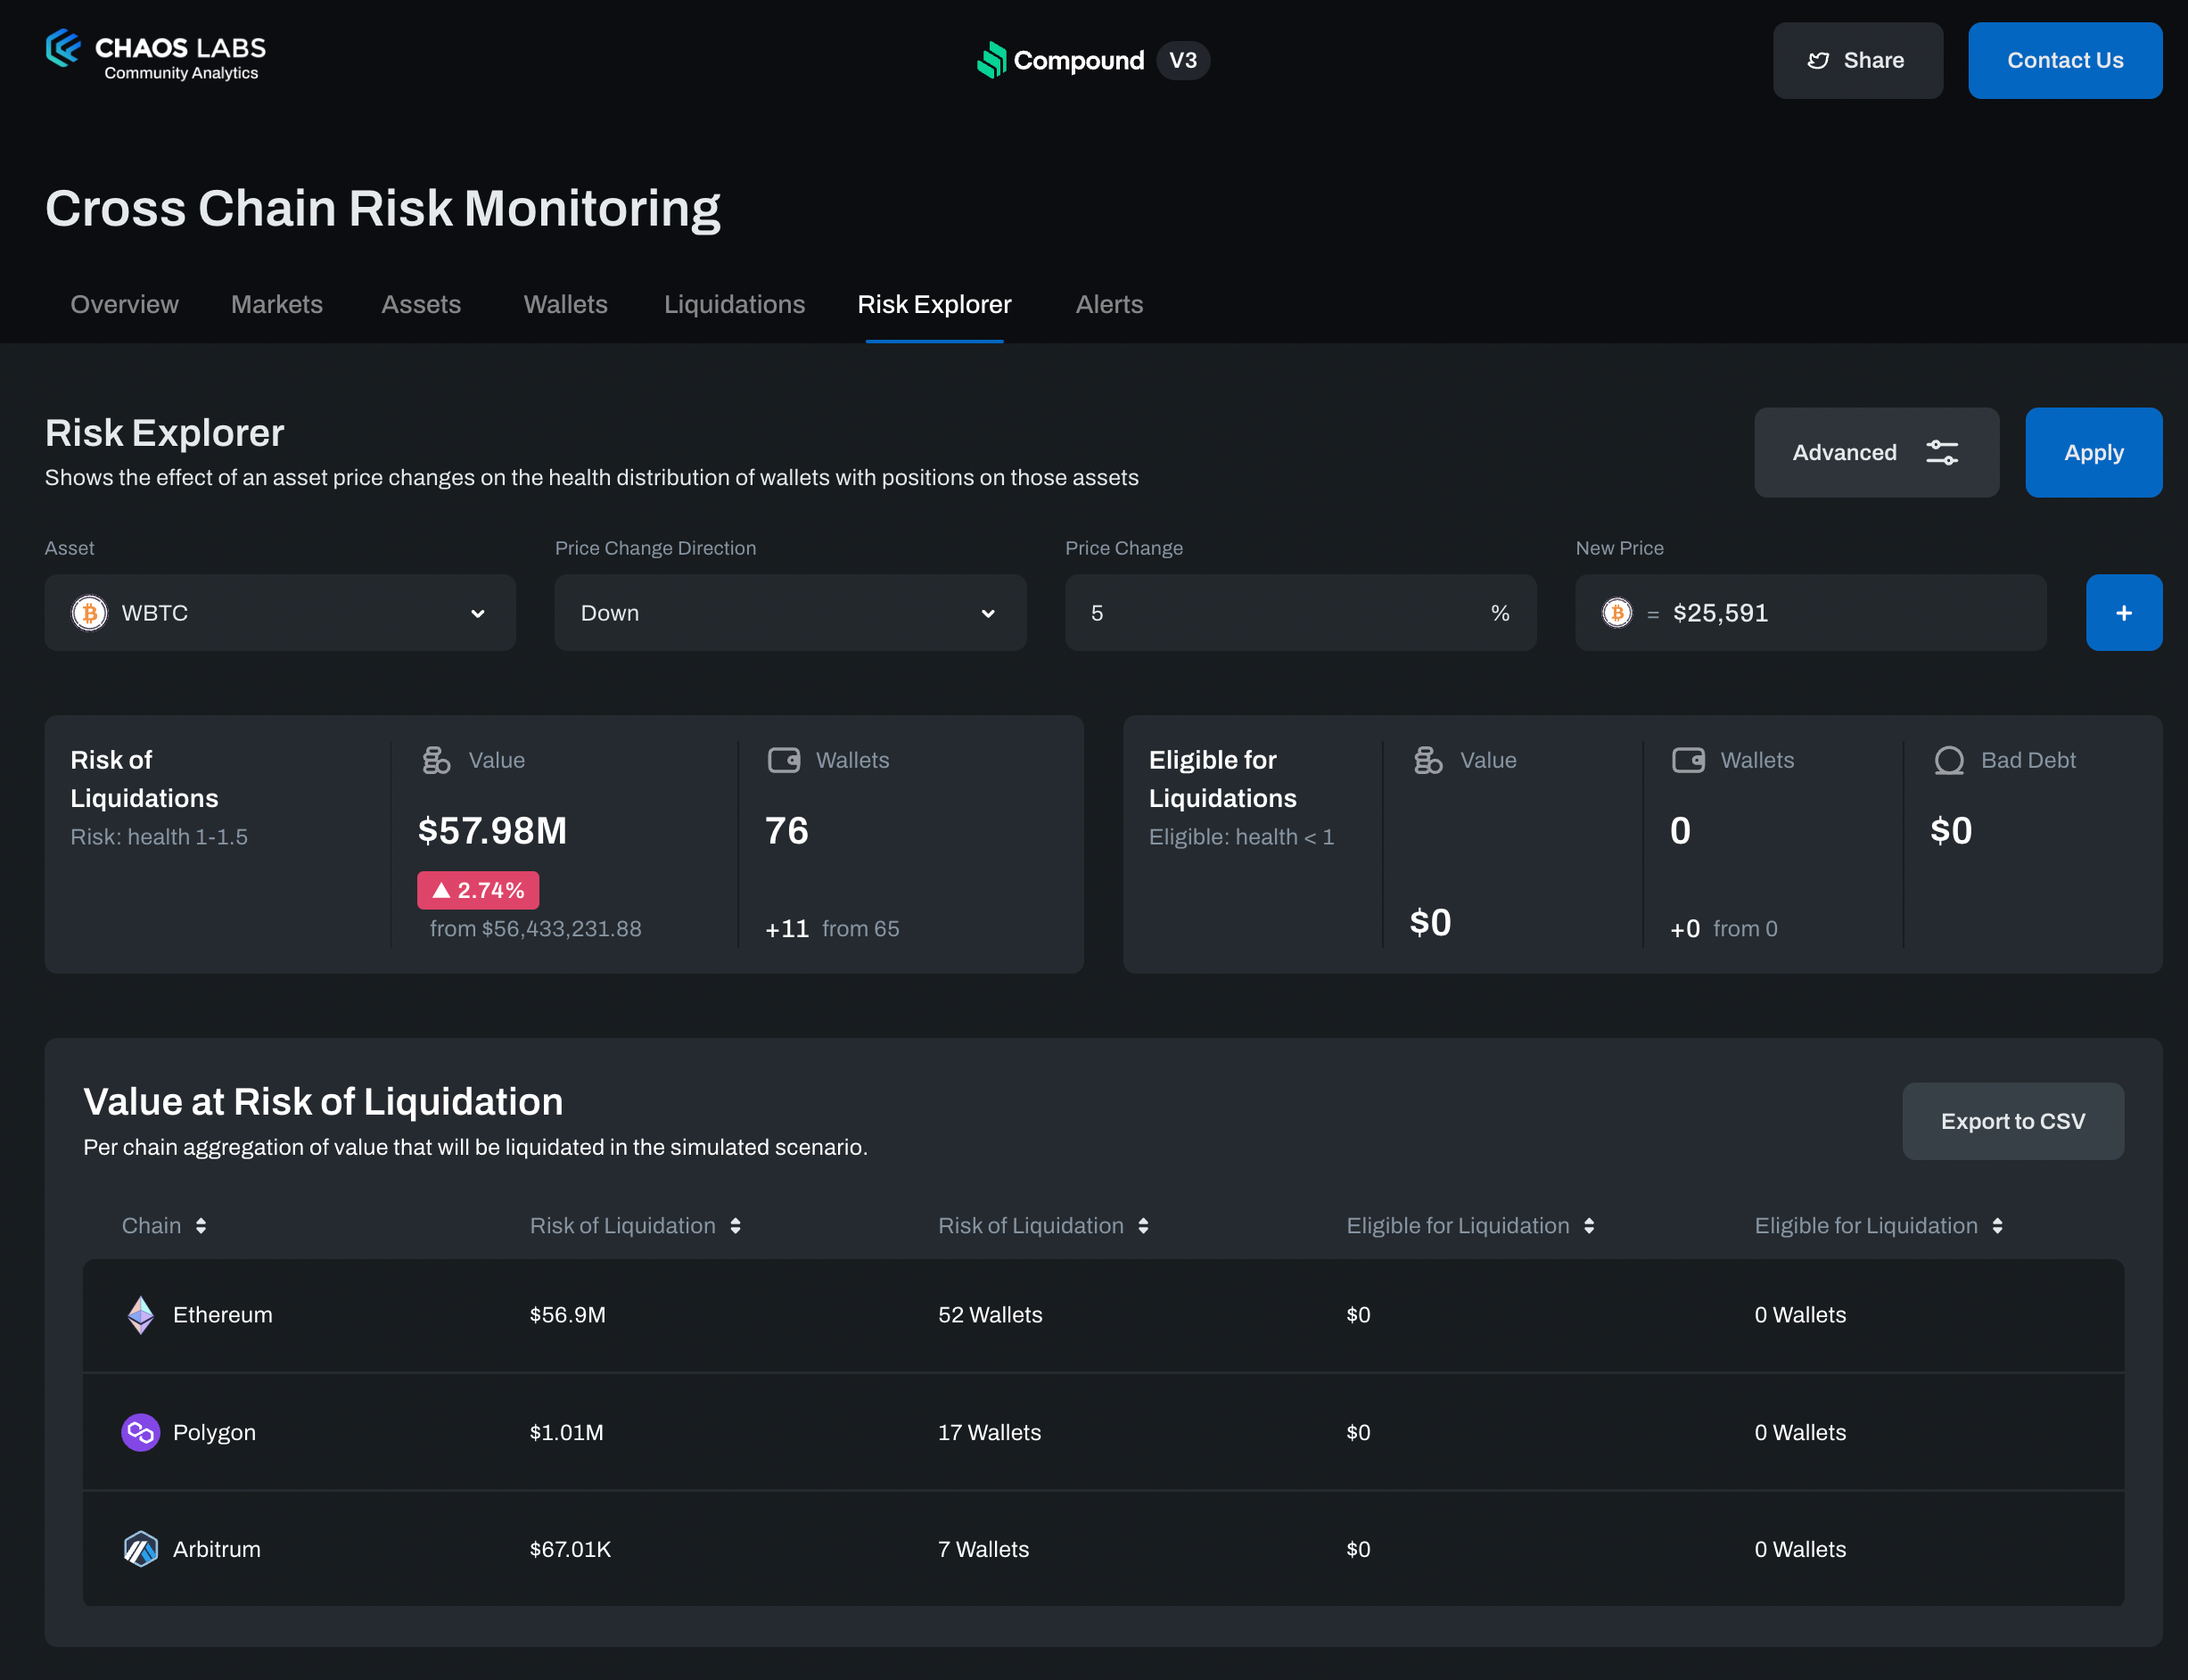
The Cross-Chain Risk Explorer allows users to explore different risk scenarios by simulating the effect of token price changes across multiple chains. Users can simulate price changes of several assets across all chains and see the impact on the protocol as a whole and for each individual chain.

With the Advanced option, users can choose a different collateral factor value for a simulated asset and filter different networks.
Wallets at Risk of Liquidation Table
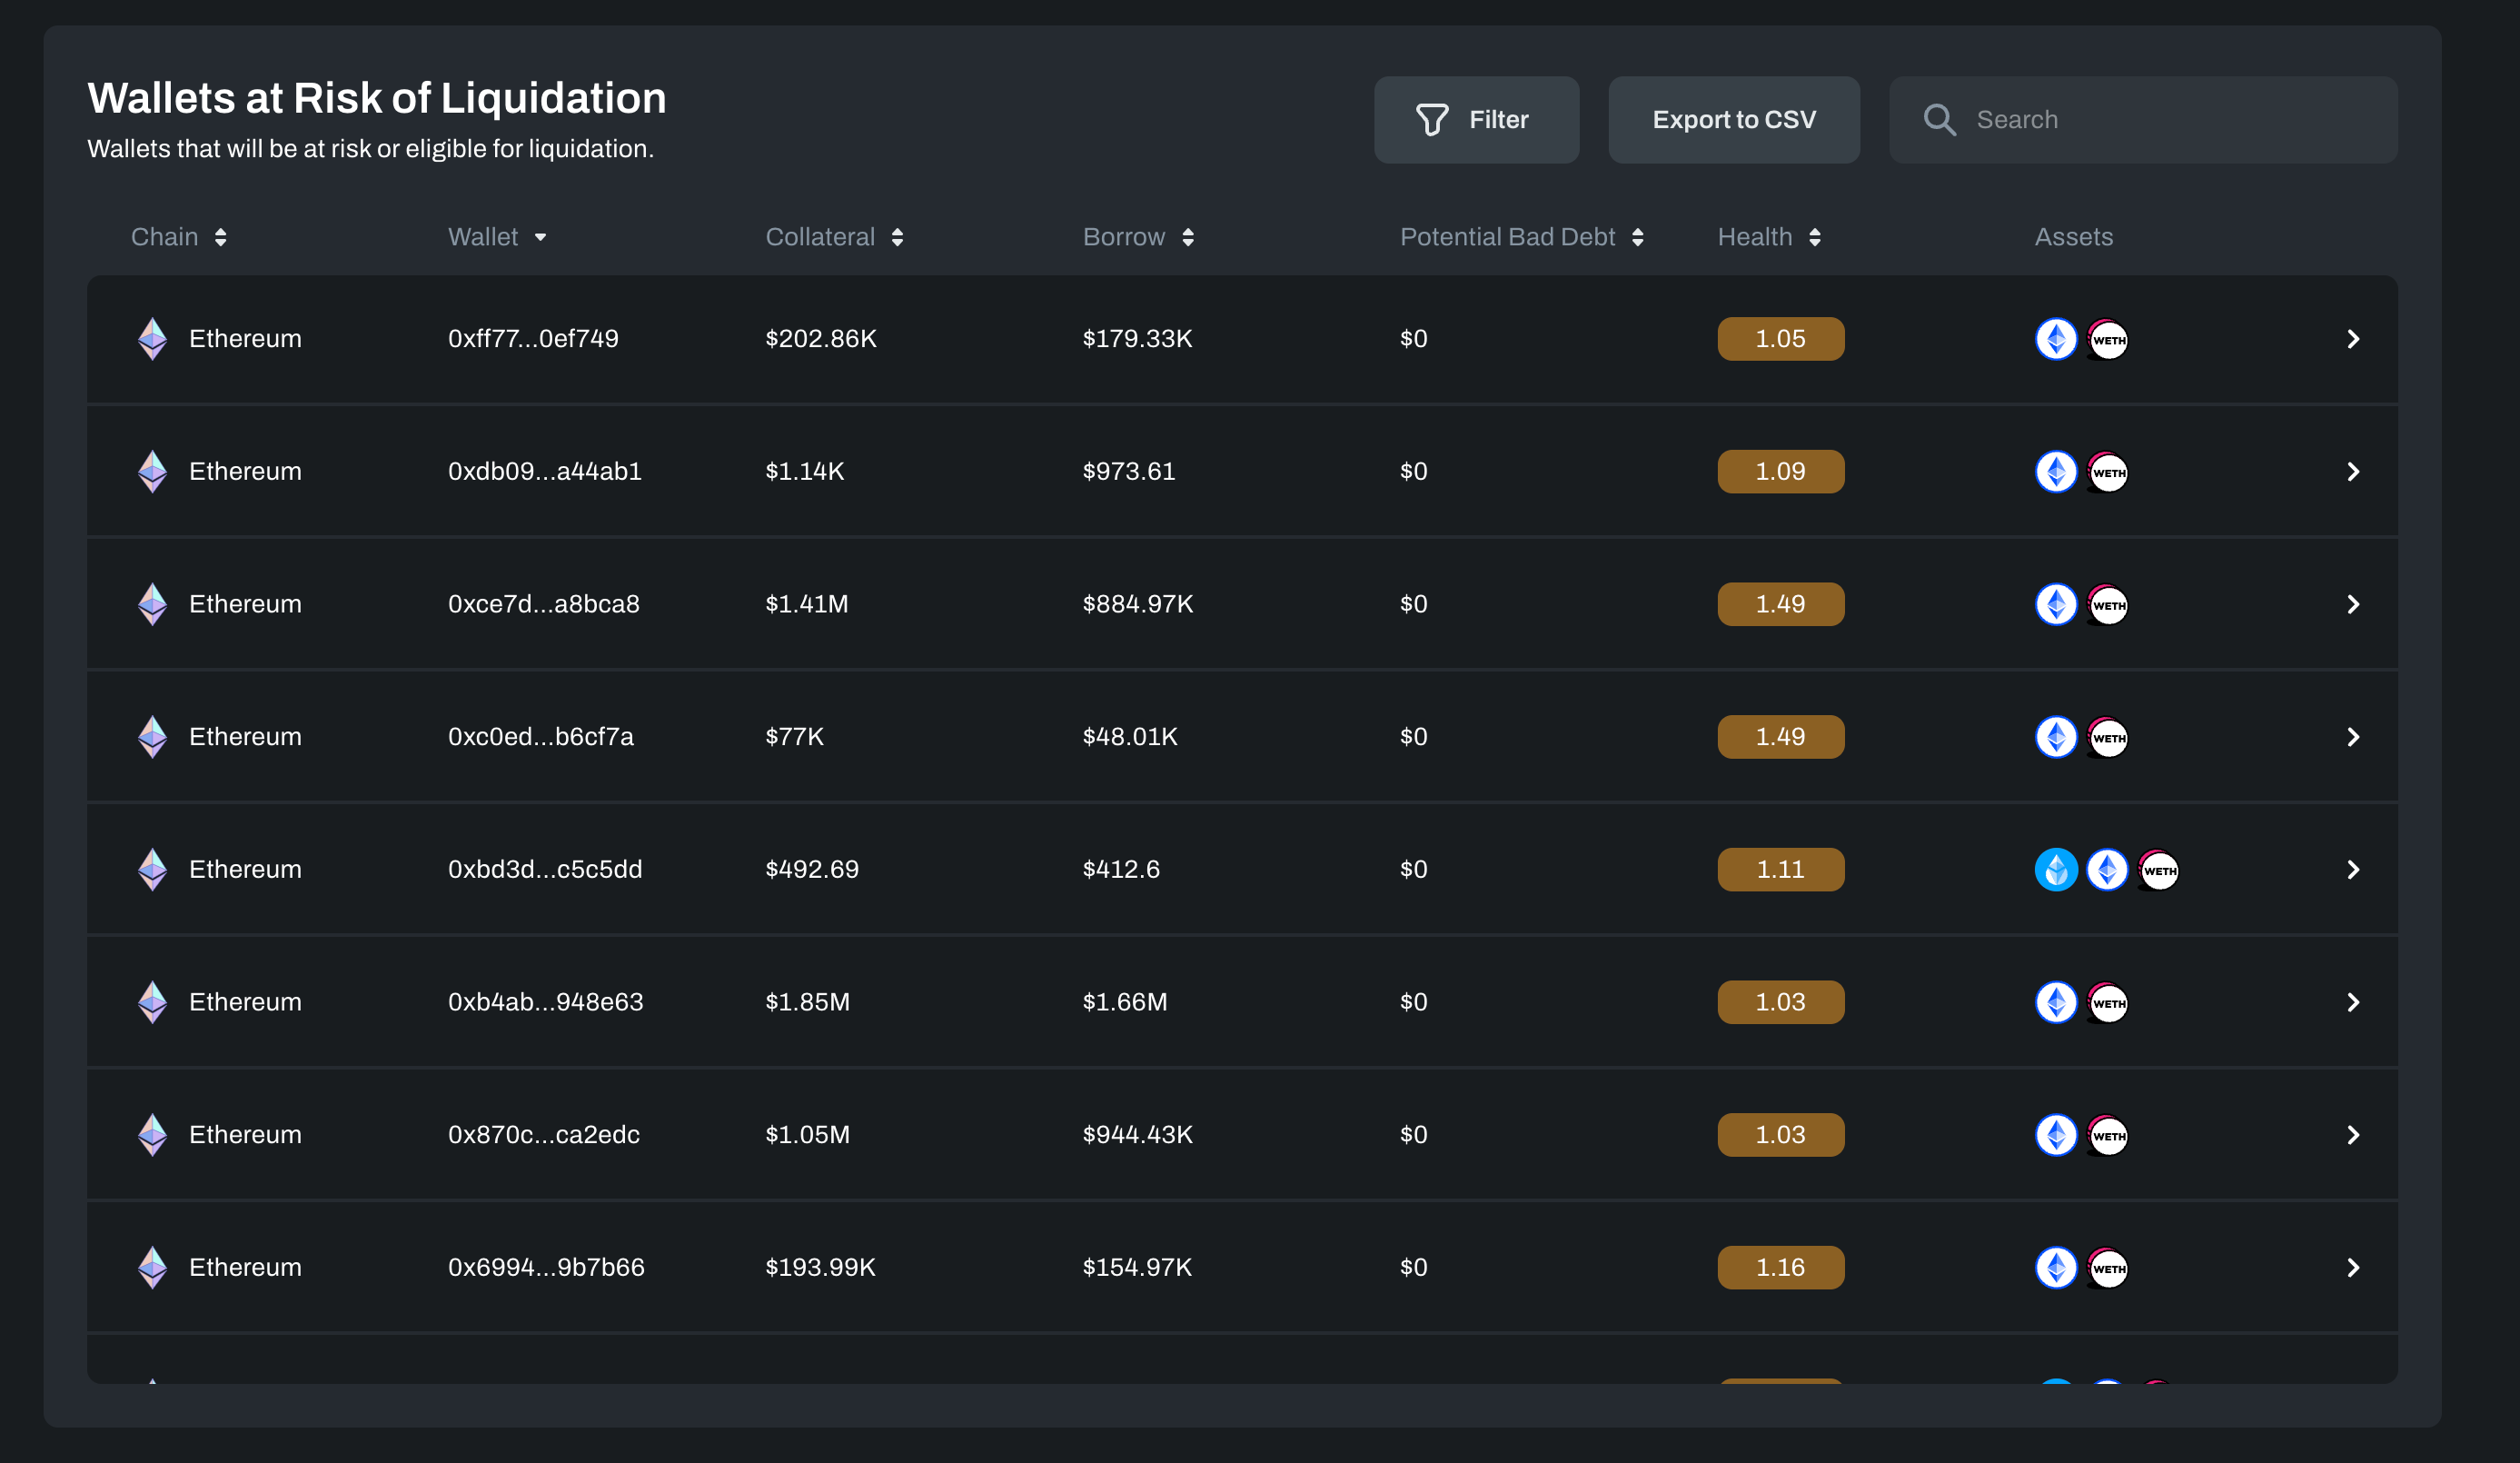
Displays a per-wallet breakdown of the simulated change, surfacing wallets that will have low health close to or are eligible for liquidation across all chains.
Alerts
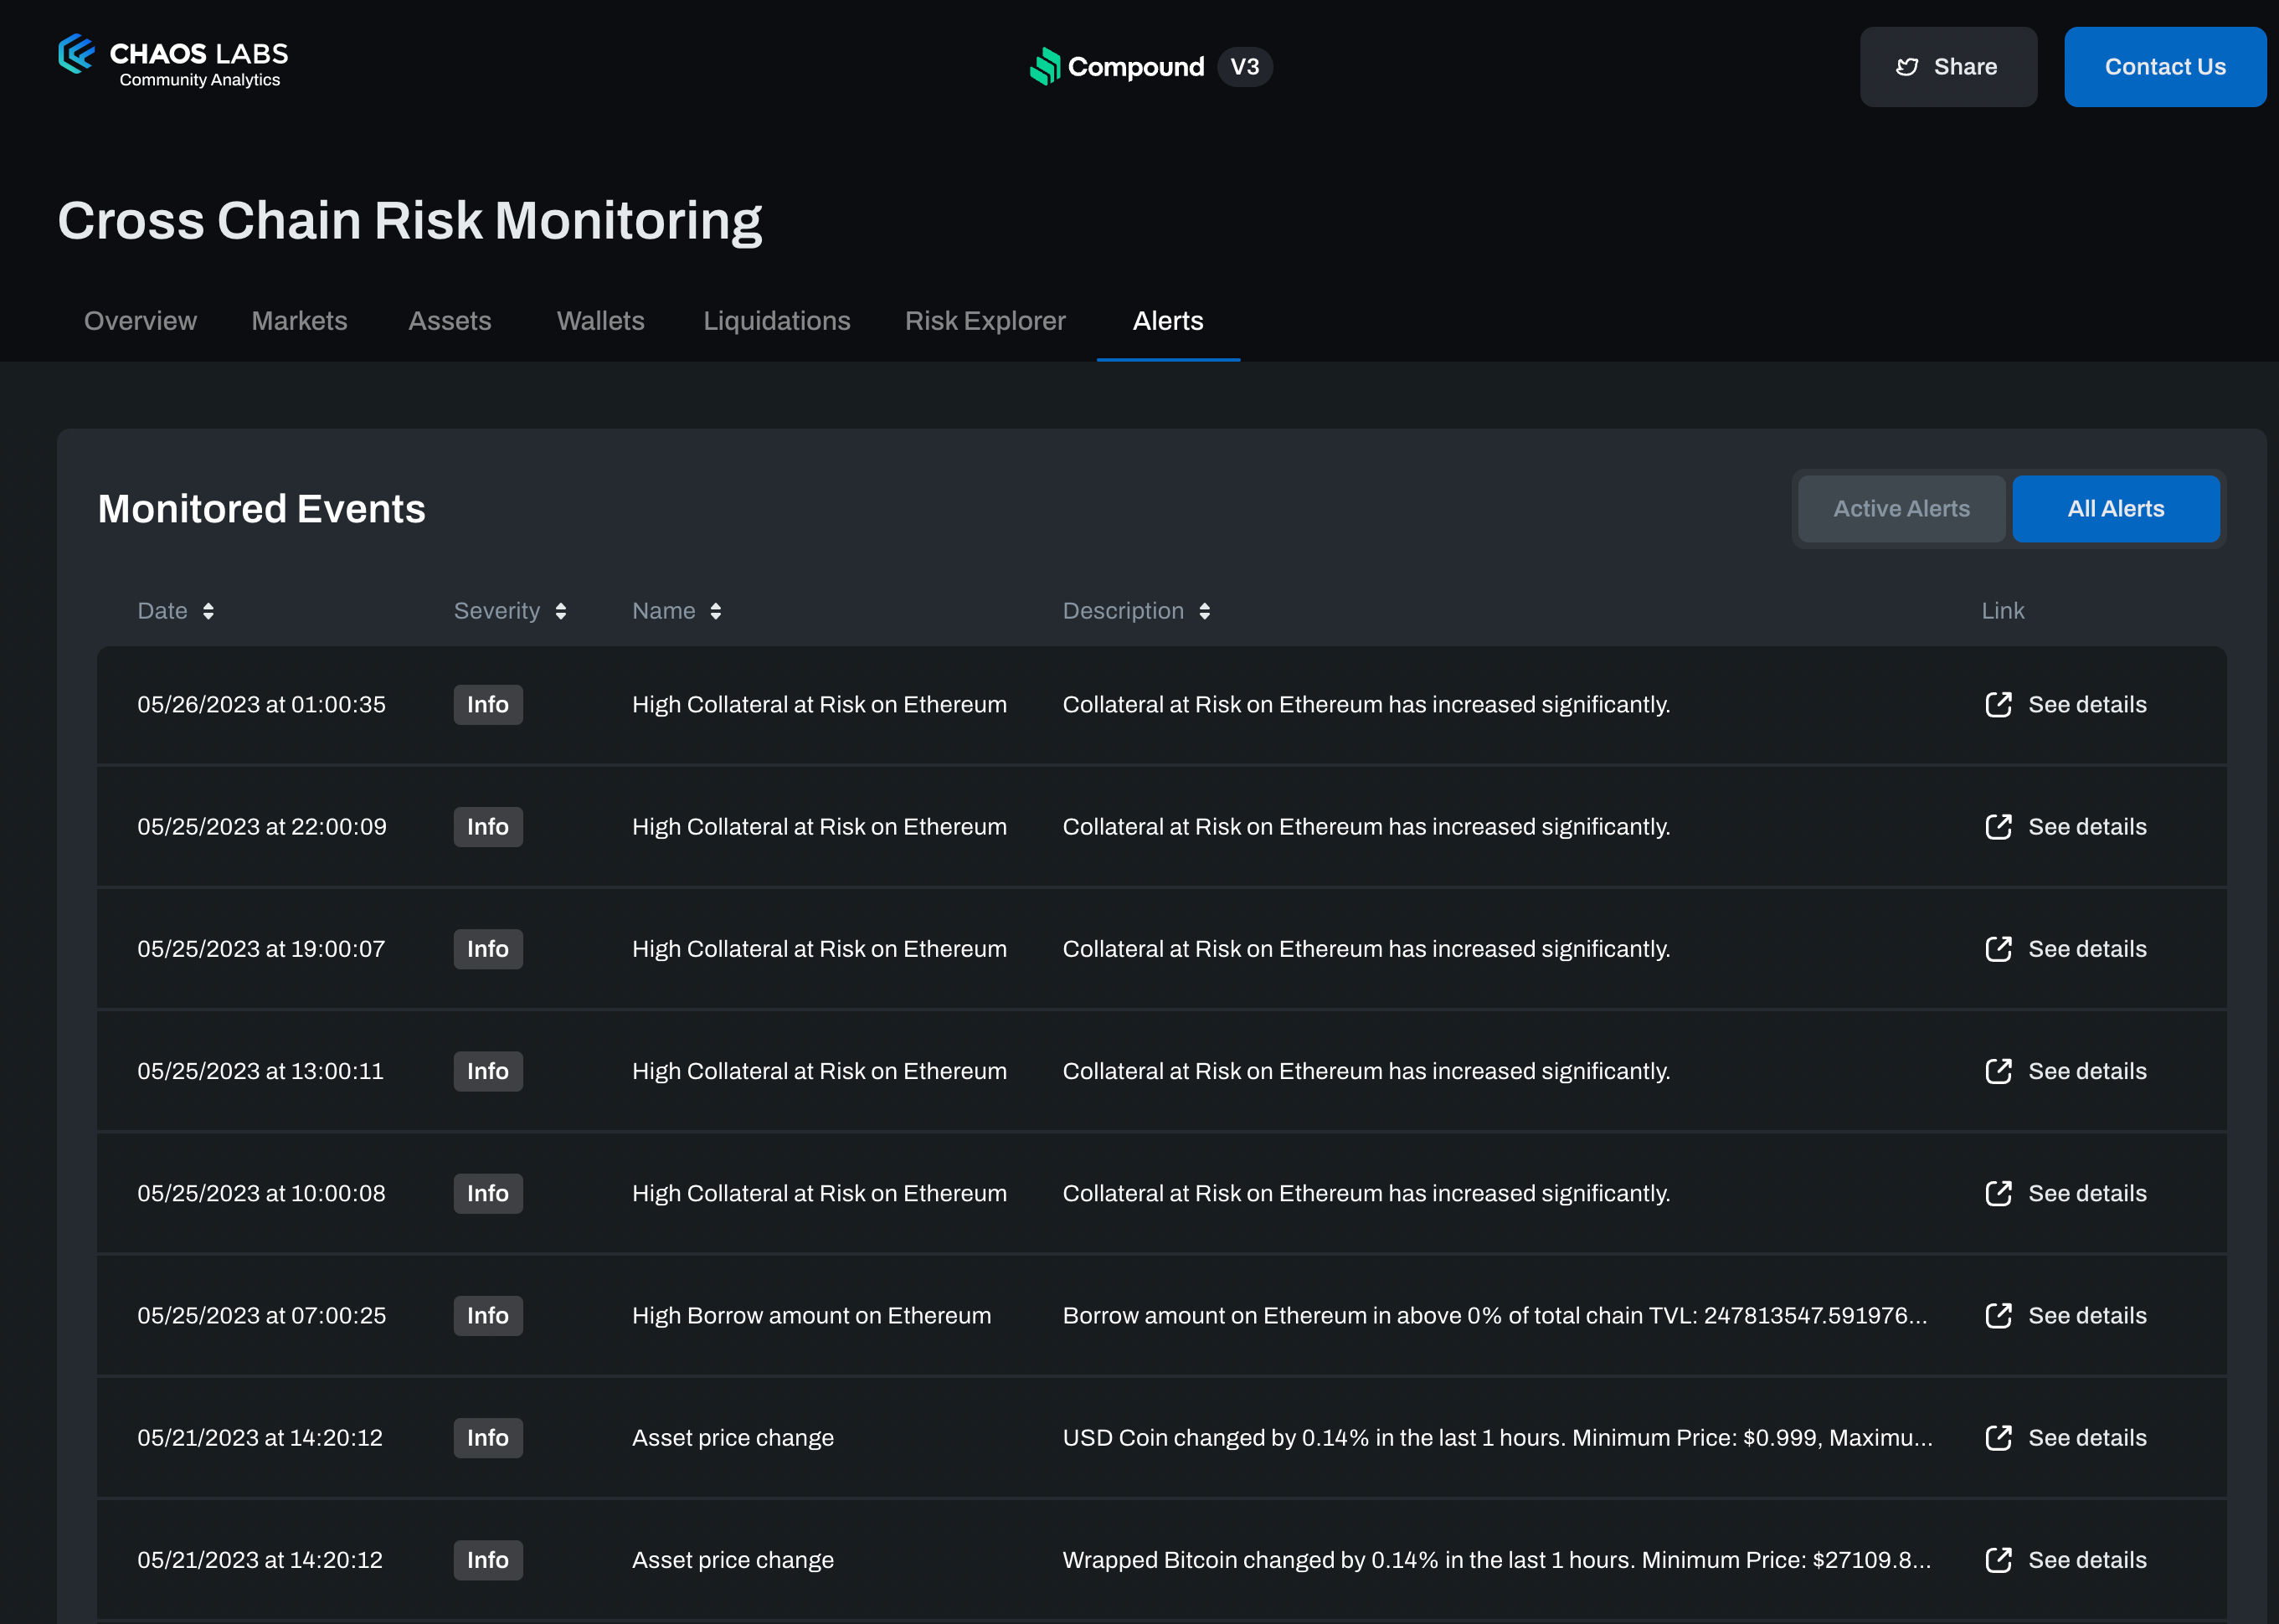
The alerts tab offers real-time notifications on Compound V3 protocol activity. Each alert features a link to the corresponding account detail or asset detail pages. Users can subscribe to these alerts by clicking on the Join Telegram Channel and receive updates directly on Telegram.
Summary
Launching the Compound Multi Chain Risk Monitoring Hub is an exciting milestone in collaborating with the Compound community. We hope this tool empowers the community to make well-informed decisions and promotes visibility over the risk and health of the Compound protocol across all chains.
Our platform is constantly evolving and growing to meet our users' needs. We invite the Compound community to explore the platform and provide your feedback.
If you have any questions or comments, don't hesitate to get in touch with us on Twitter or via this form.
The Role of Oracle Security in the DeFi Derivatives Market With Chainlink and GMX
The DeFi derivatives market is rapidly evolving, thanks to low-cost and high-throughput blockchains like Arbitrum. Minimal gas fees and short time-to-finality make possible an optimized on-chain trading experience like the one GMX offers. This innovation sets the stage for what we anticipate to be a period of explosive growth in this sector.
Uniswap V3 TWAP: Assessing TWAP Market Risk
Assessing the likelihood and feasibility of manipulating Uniswap's V3 TWAP oracles, focusing on the worst-case scenario for low liquidity assets.
Risk Less.
Know More.
Get priority access to the most powerful financial intelligence tool on the market.