Jupiter Risk Monitoring and Alerting Platform
Table of Contents
Introduction
Chaos Labs is thrilled to announce the launch of the Jupiter Risk Monitoring and Alerting platform. This advanced system provides comprehensive analytics and observability, offering the Jupiter community a gateway to abundant data and risk intelligence associated with the protocol, all under one unified platform.
The platform is designed to help the Jupiter community better understand the protocol’s risk profile and overall health. With comprehensive analytics and observability features, the platform empowers users to make informed, strategic decisions. Users will have access to crucial asset data and detailed insights into usage patterns, trends, and real-time analysis, all designed to support high-level decision-making processes.
Below is a written tutorial walking through the platform. If you prefer a video tutorial, please view the following recording.
Platform Deep Dive
Overview Page
The Overview page is the main section of the Risk Monitoring and Alerting platform provides high-level metrics aggregated across Jupiter, including 24-hour volume, total open interest, open interest imbalance, and number of open positions.

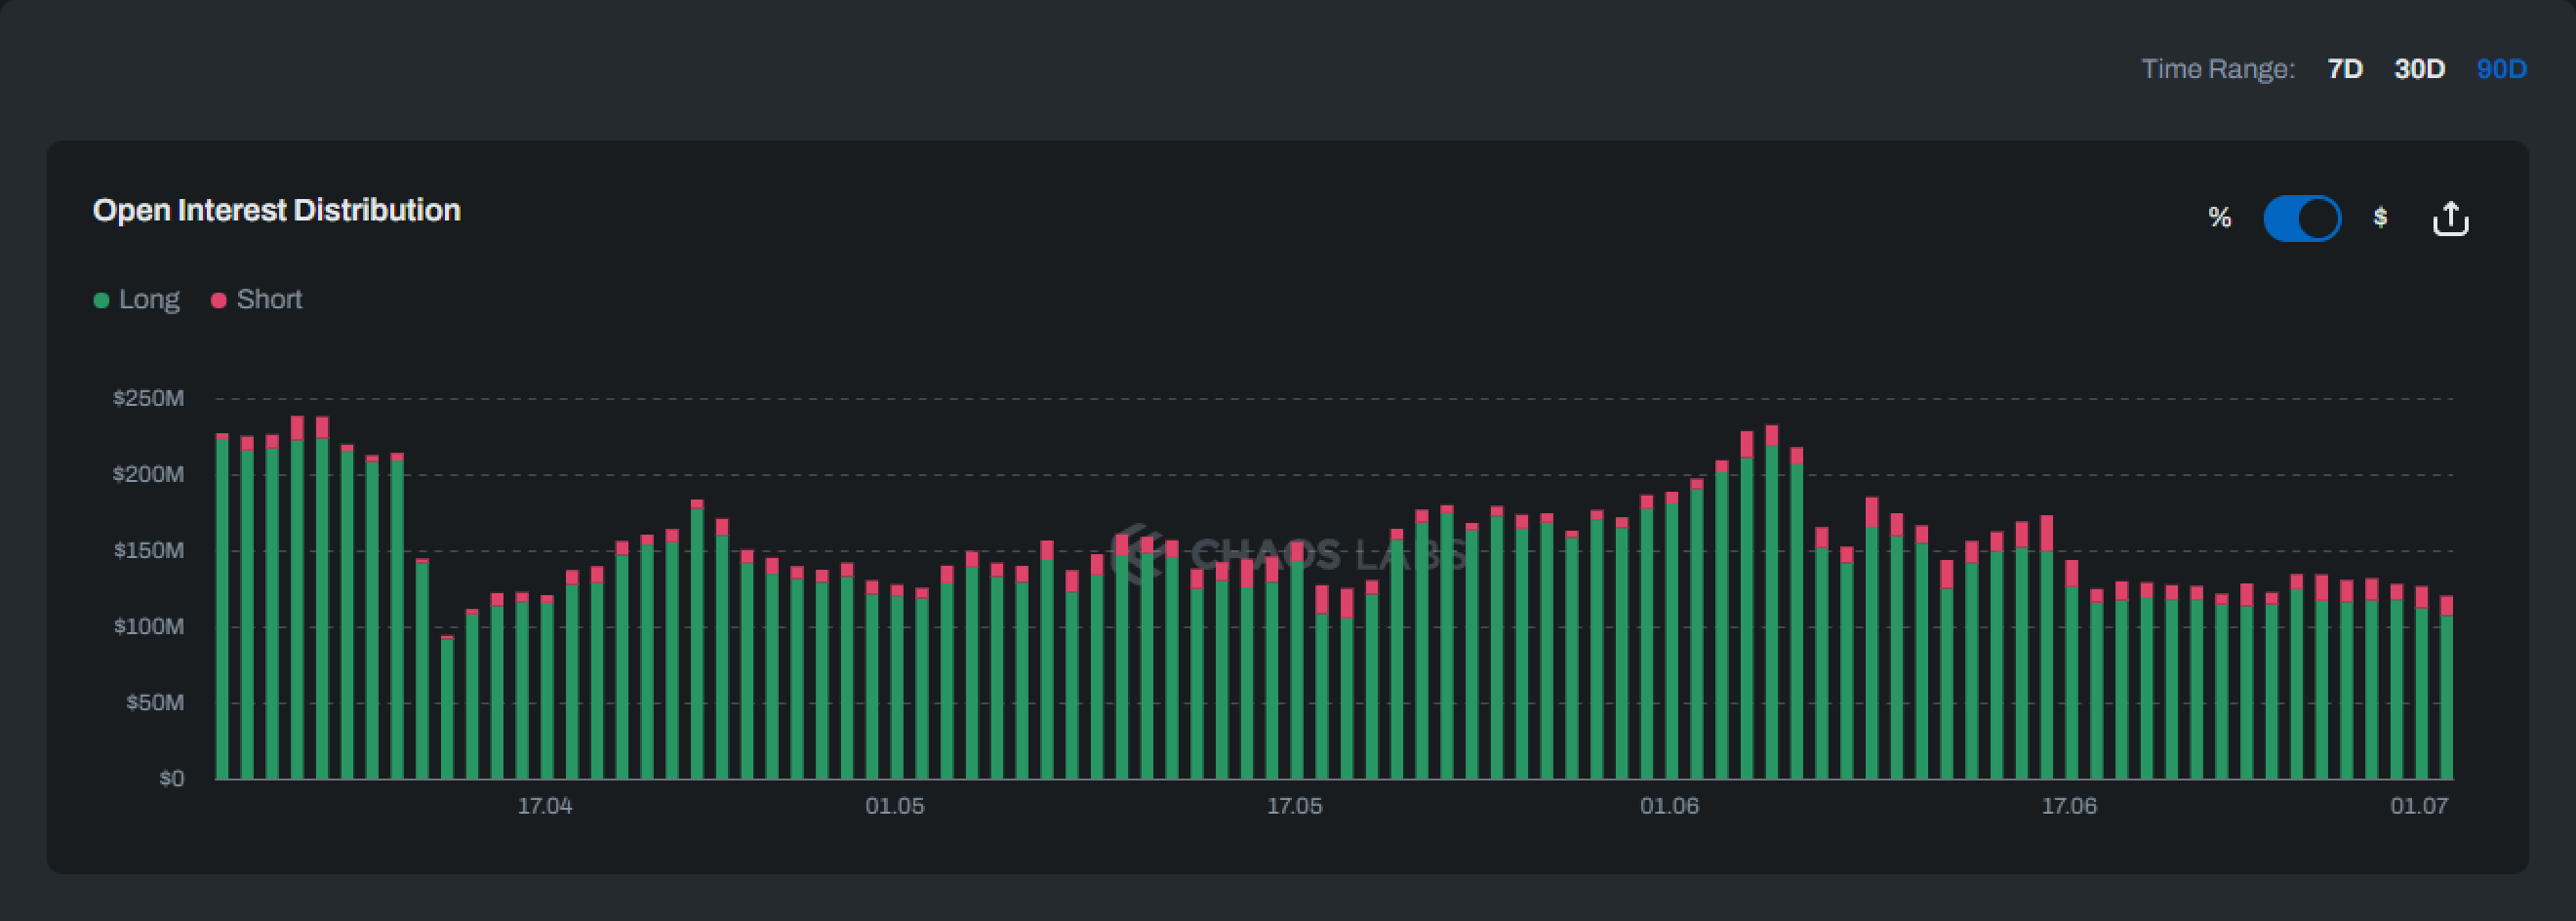
Below, these key metrics, you can view a graph that shows the distribution of open interest across time, illustrating the difference between long and short open interest, expressed both as a percentage and as a notional value. We can see here that traders on the Jupiter platform tend to prefer opening long positions.
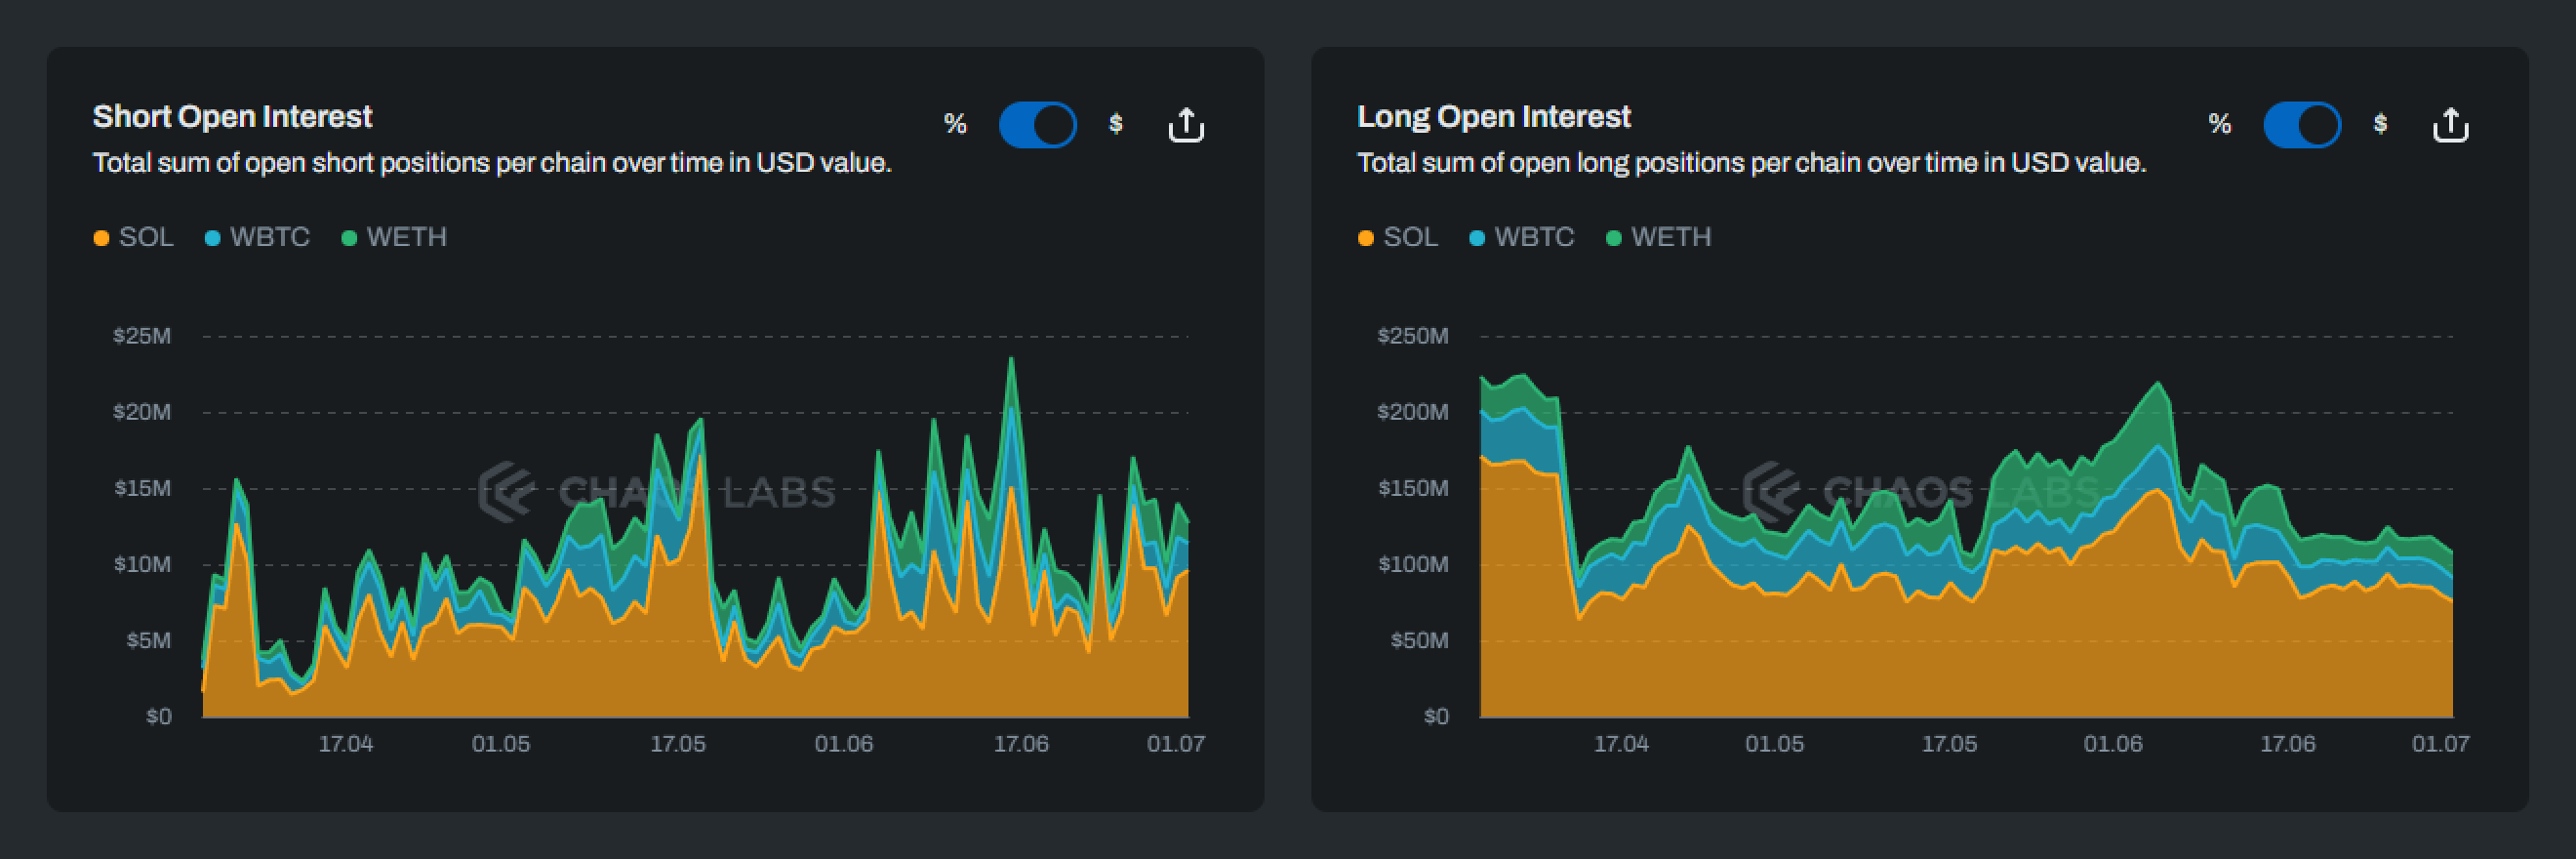
Next, you can view two charts that illustrate a further breakdown between short and long open interest across the three markets that Jupiter supports. We can see here that the SOL market is the most popular for both shorts and longs.
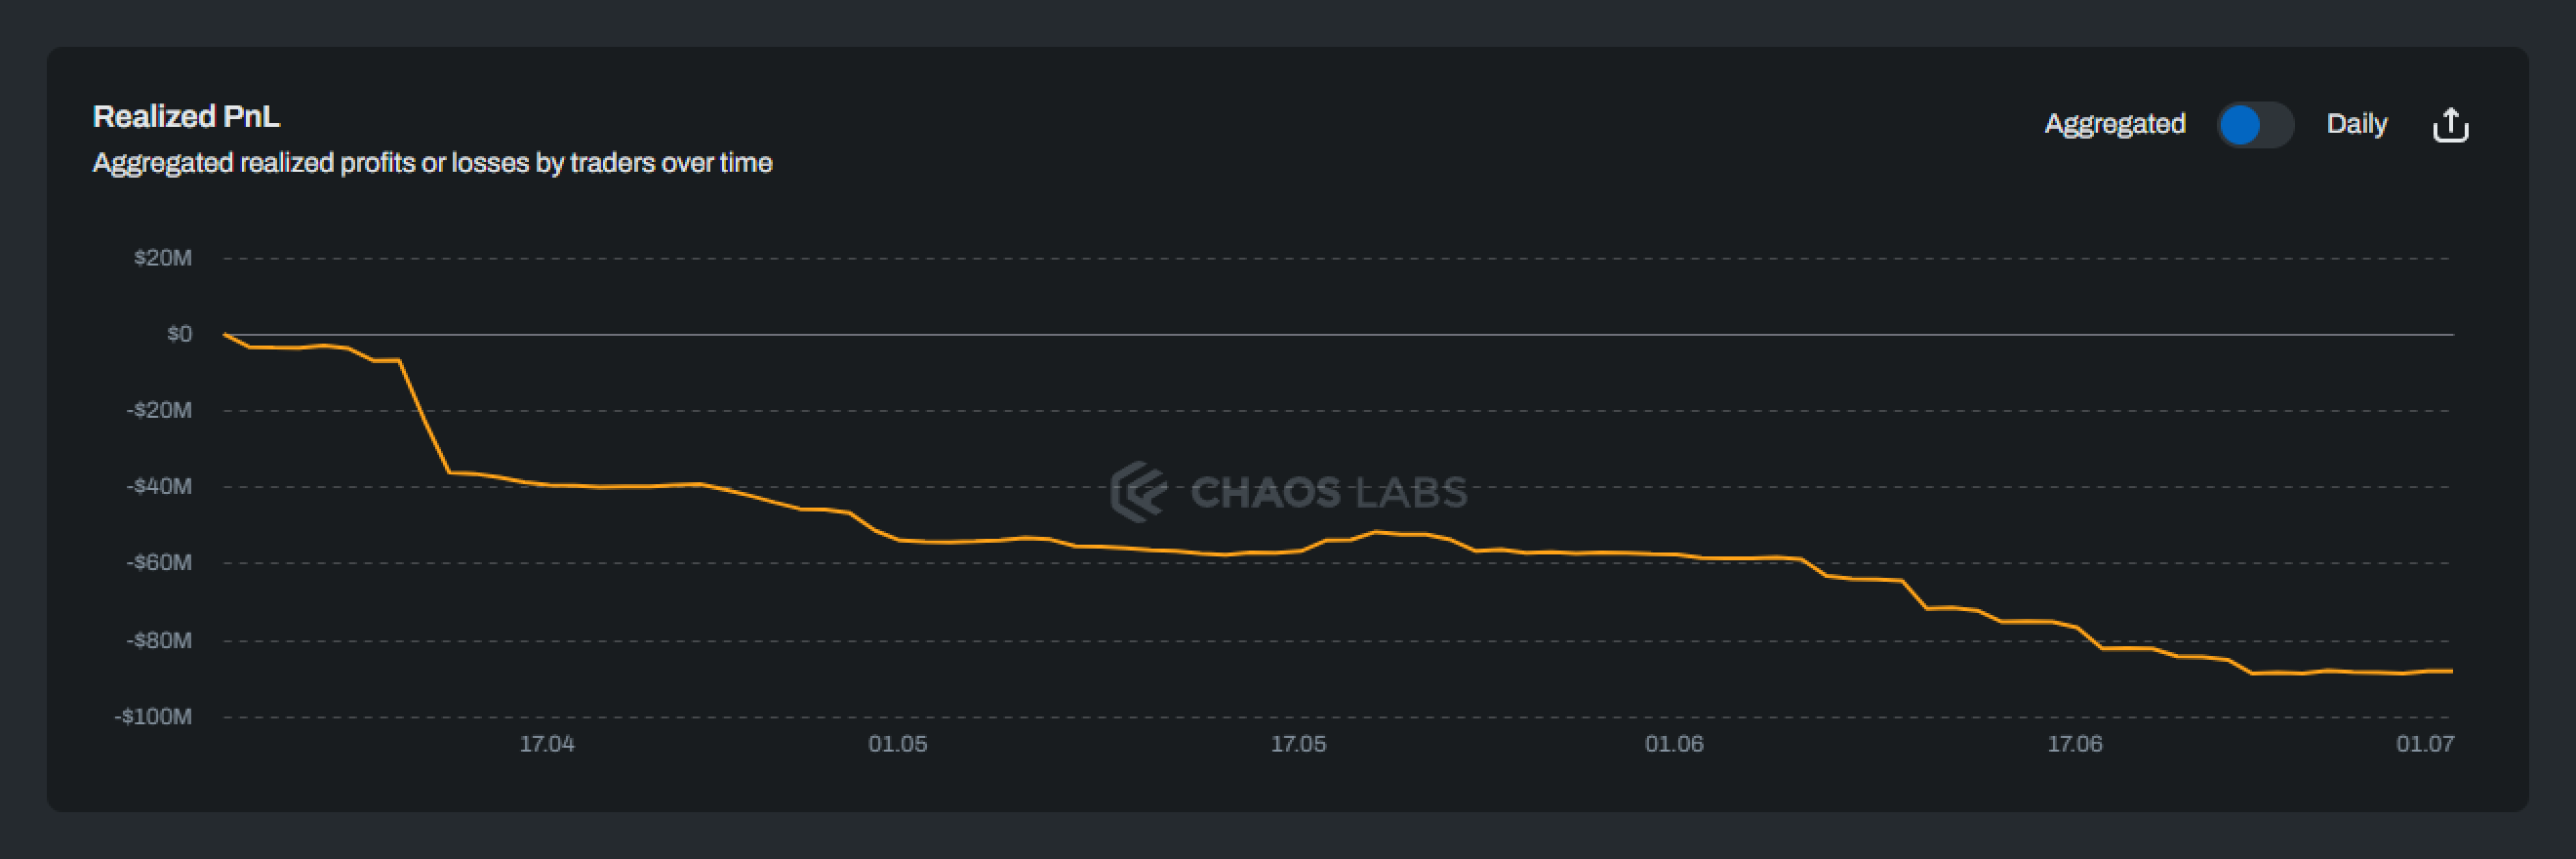
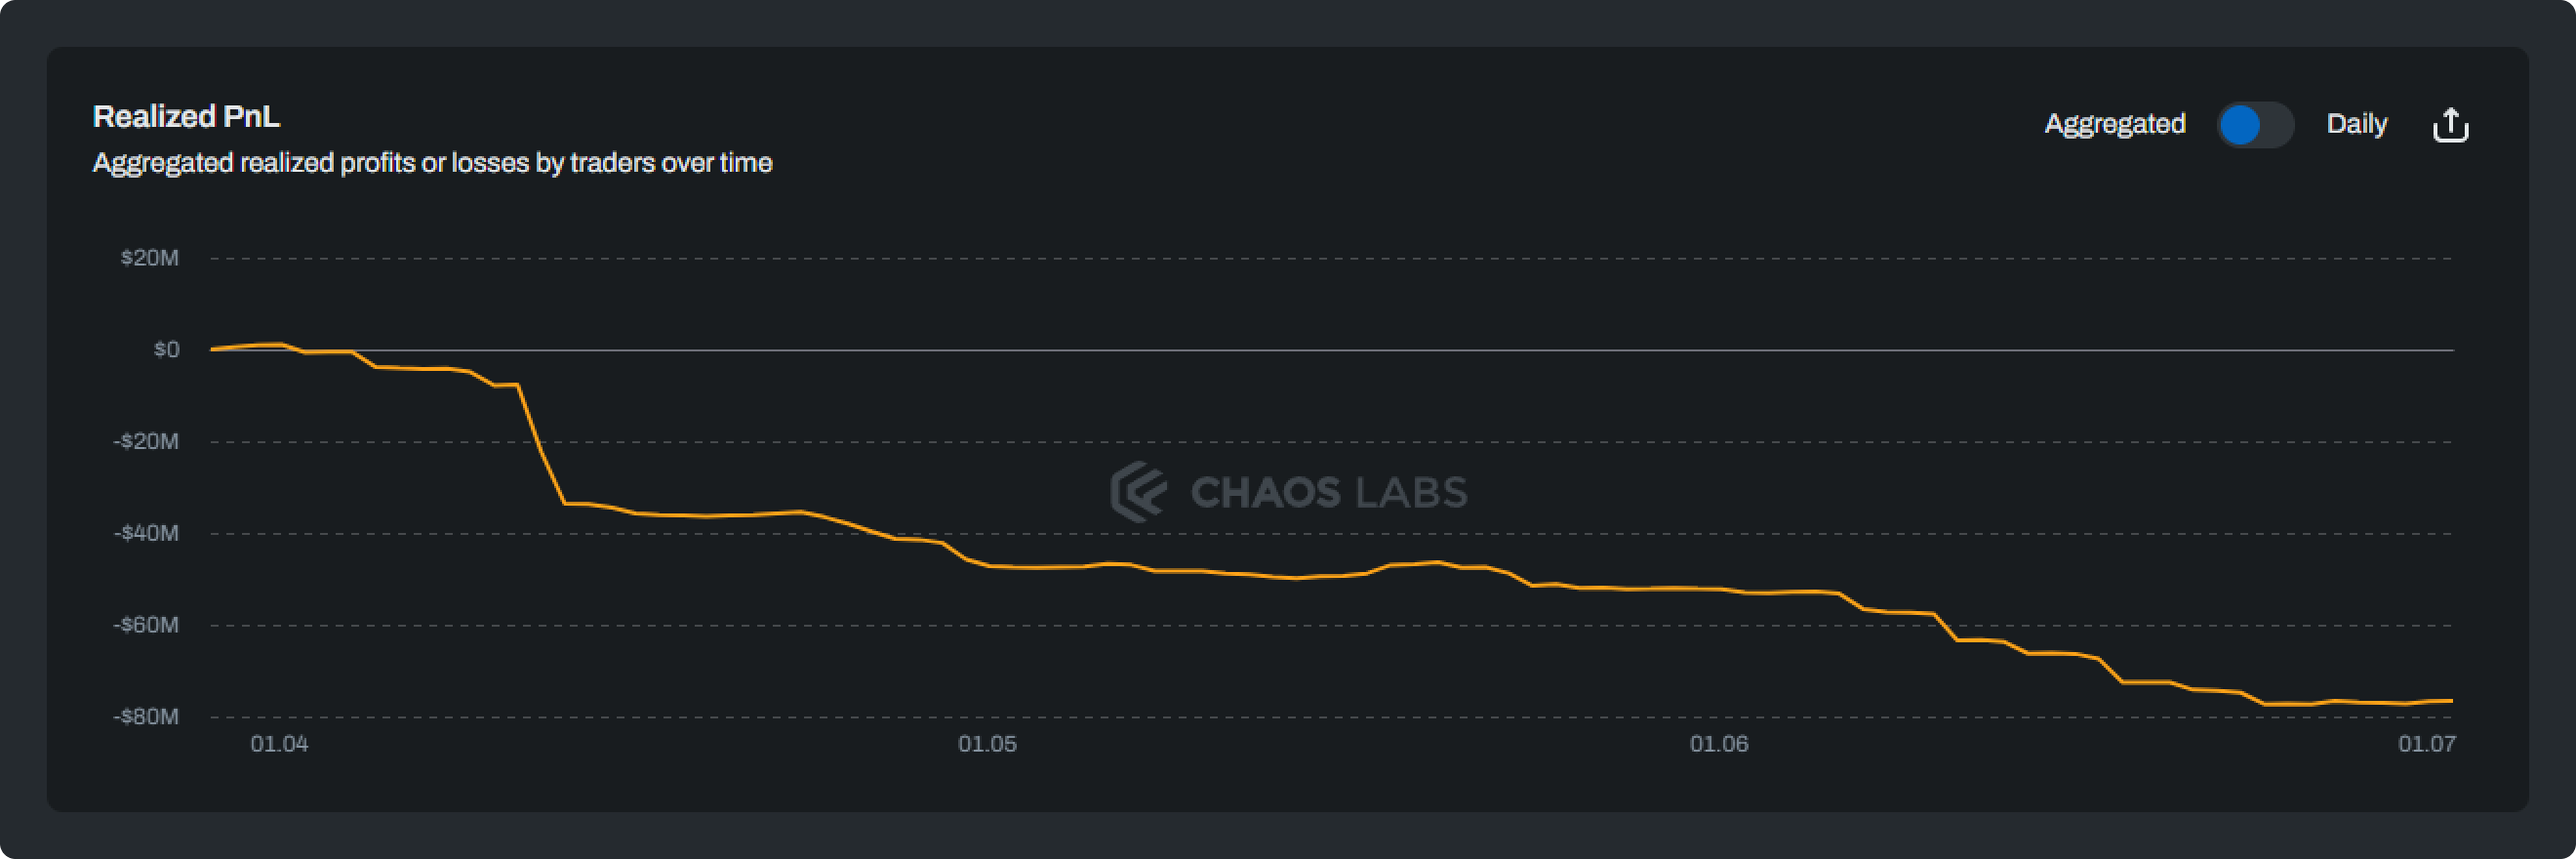
Scrolling further down the page, you can see the cumulative traders' realized PnL, including fees, from closed positions over time. This metric reflects the inverse of LPs' and protocol profit, as well as trading volume over time. You can toggle between the ‘Aggregated’ and ‘Daily’ views to get a different perspective.
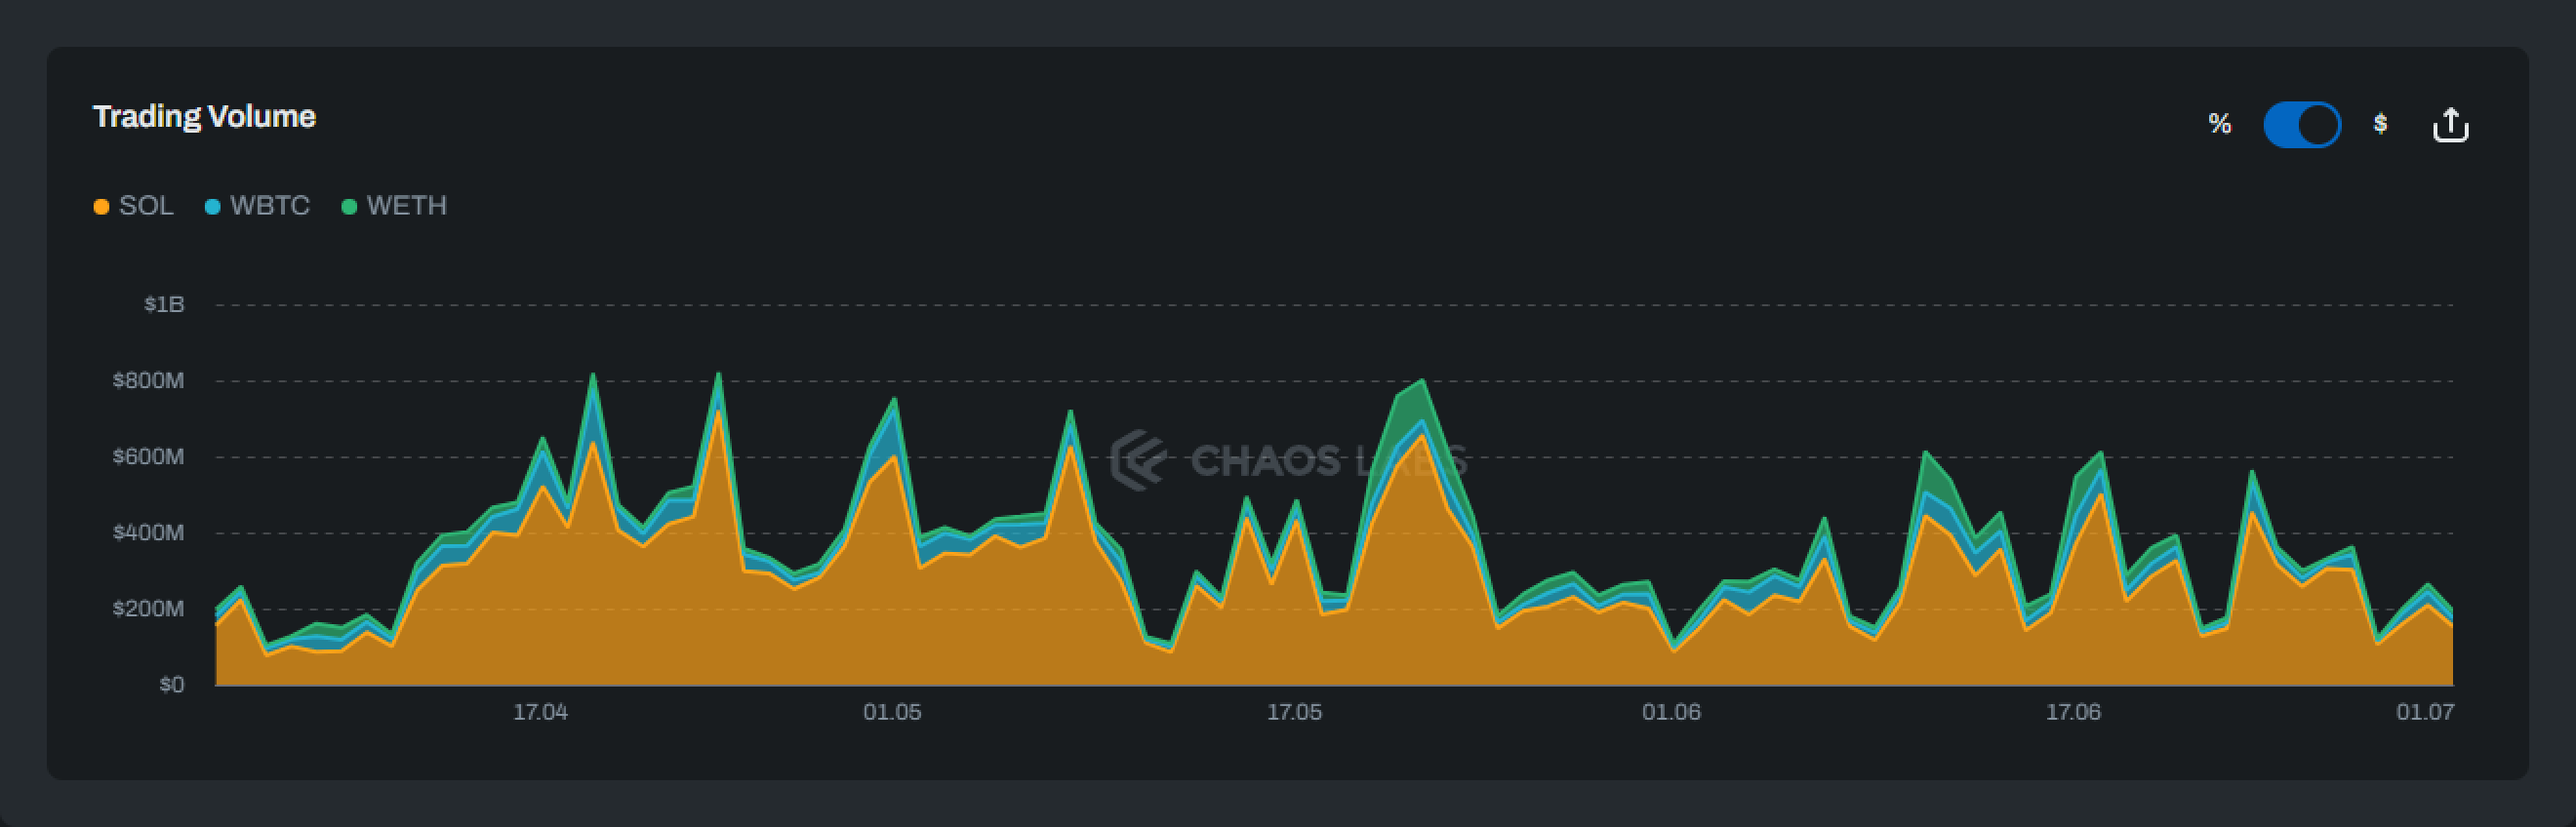
Finally, at the bottom of the page, you can see the trading volume broken down by market, expressed both as a percentage and notional value. This chart re-emphasizes the popularity of the SOL market on Jupiter.
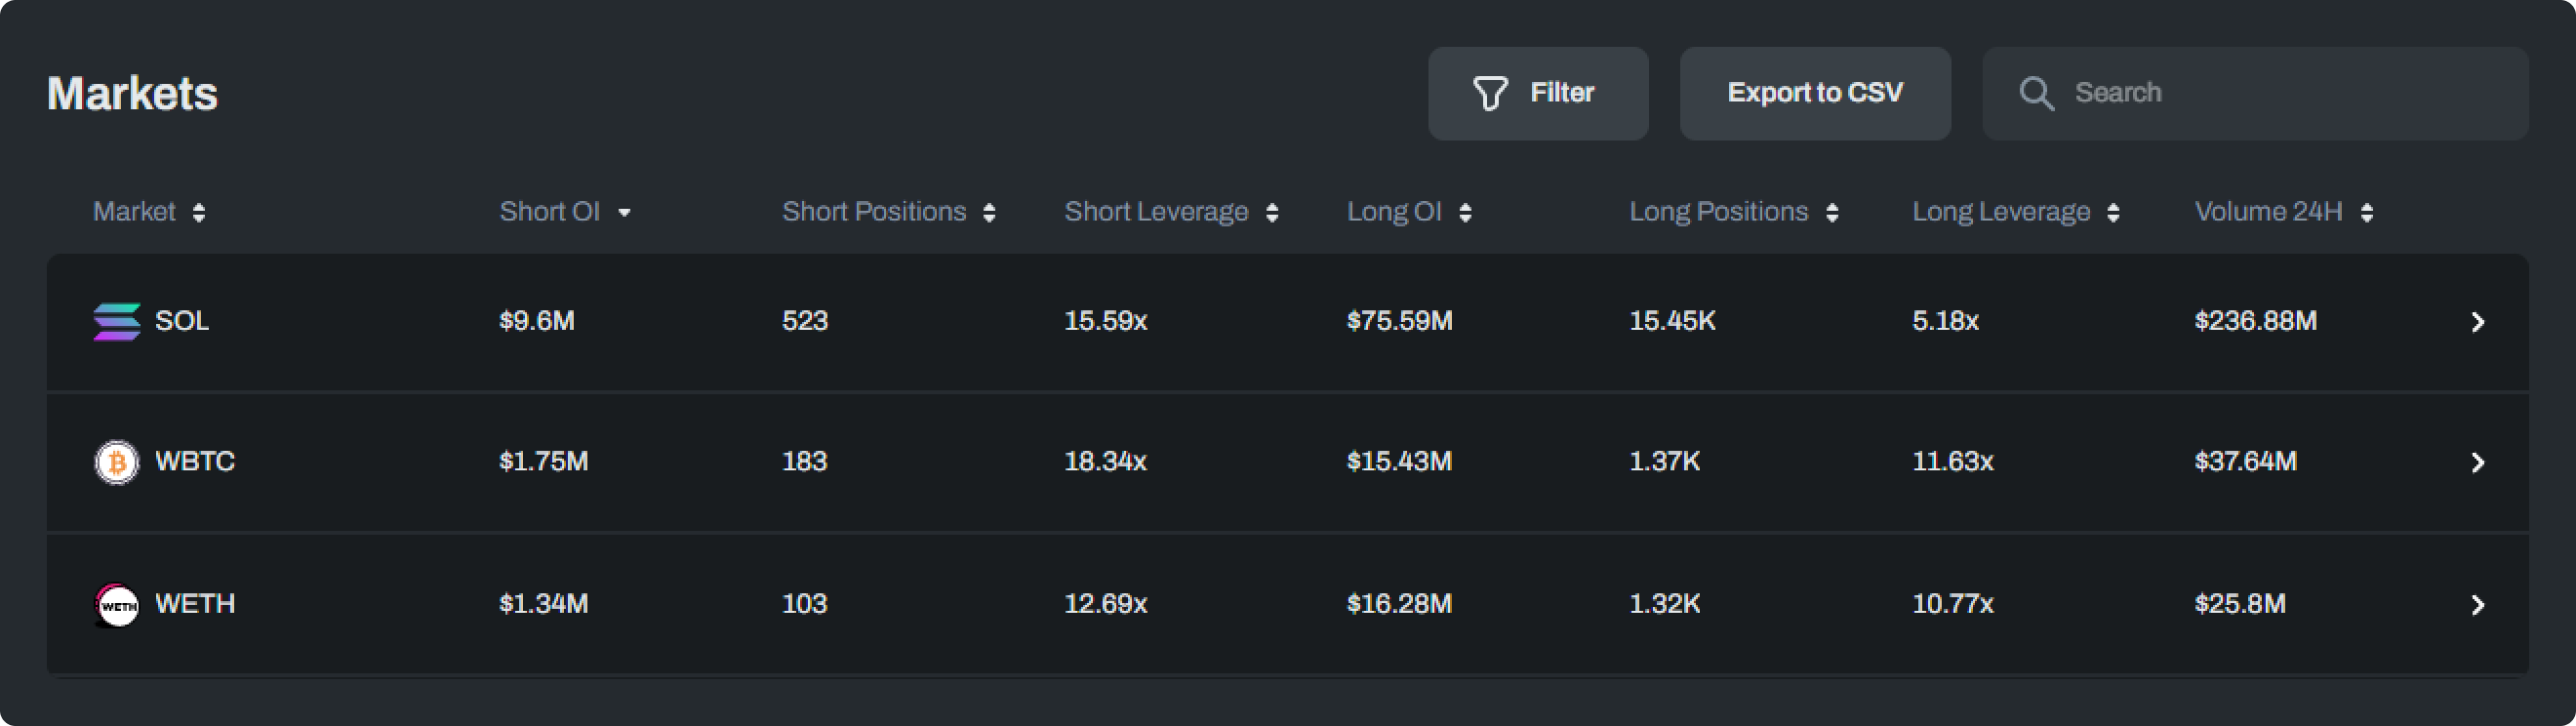
Markets Page
The next tab links to the Markets page. This page presents high-level metrics for all supported perpetual markets, which currently include SOL, WETH, and WBTC.
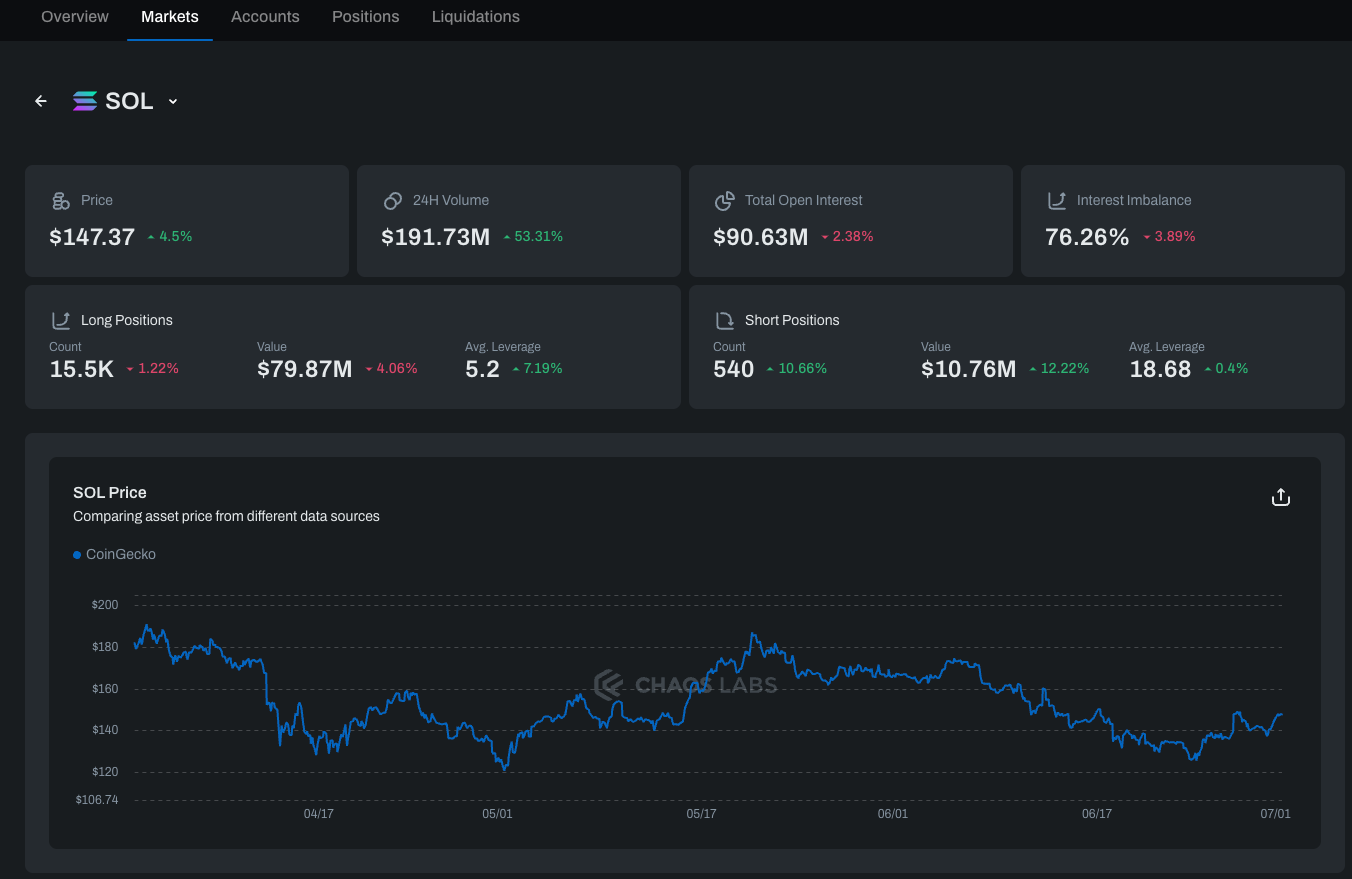
If you want to investigate a specific market further, you can click on it, which will take you to a page with more granular detail specific to that market. In the example below, we’ve selected the SOL market. For every market, we display the asset price, 24-hour volume, total open interest, open interest imbalance, and high-level metrics for long and short positions.
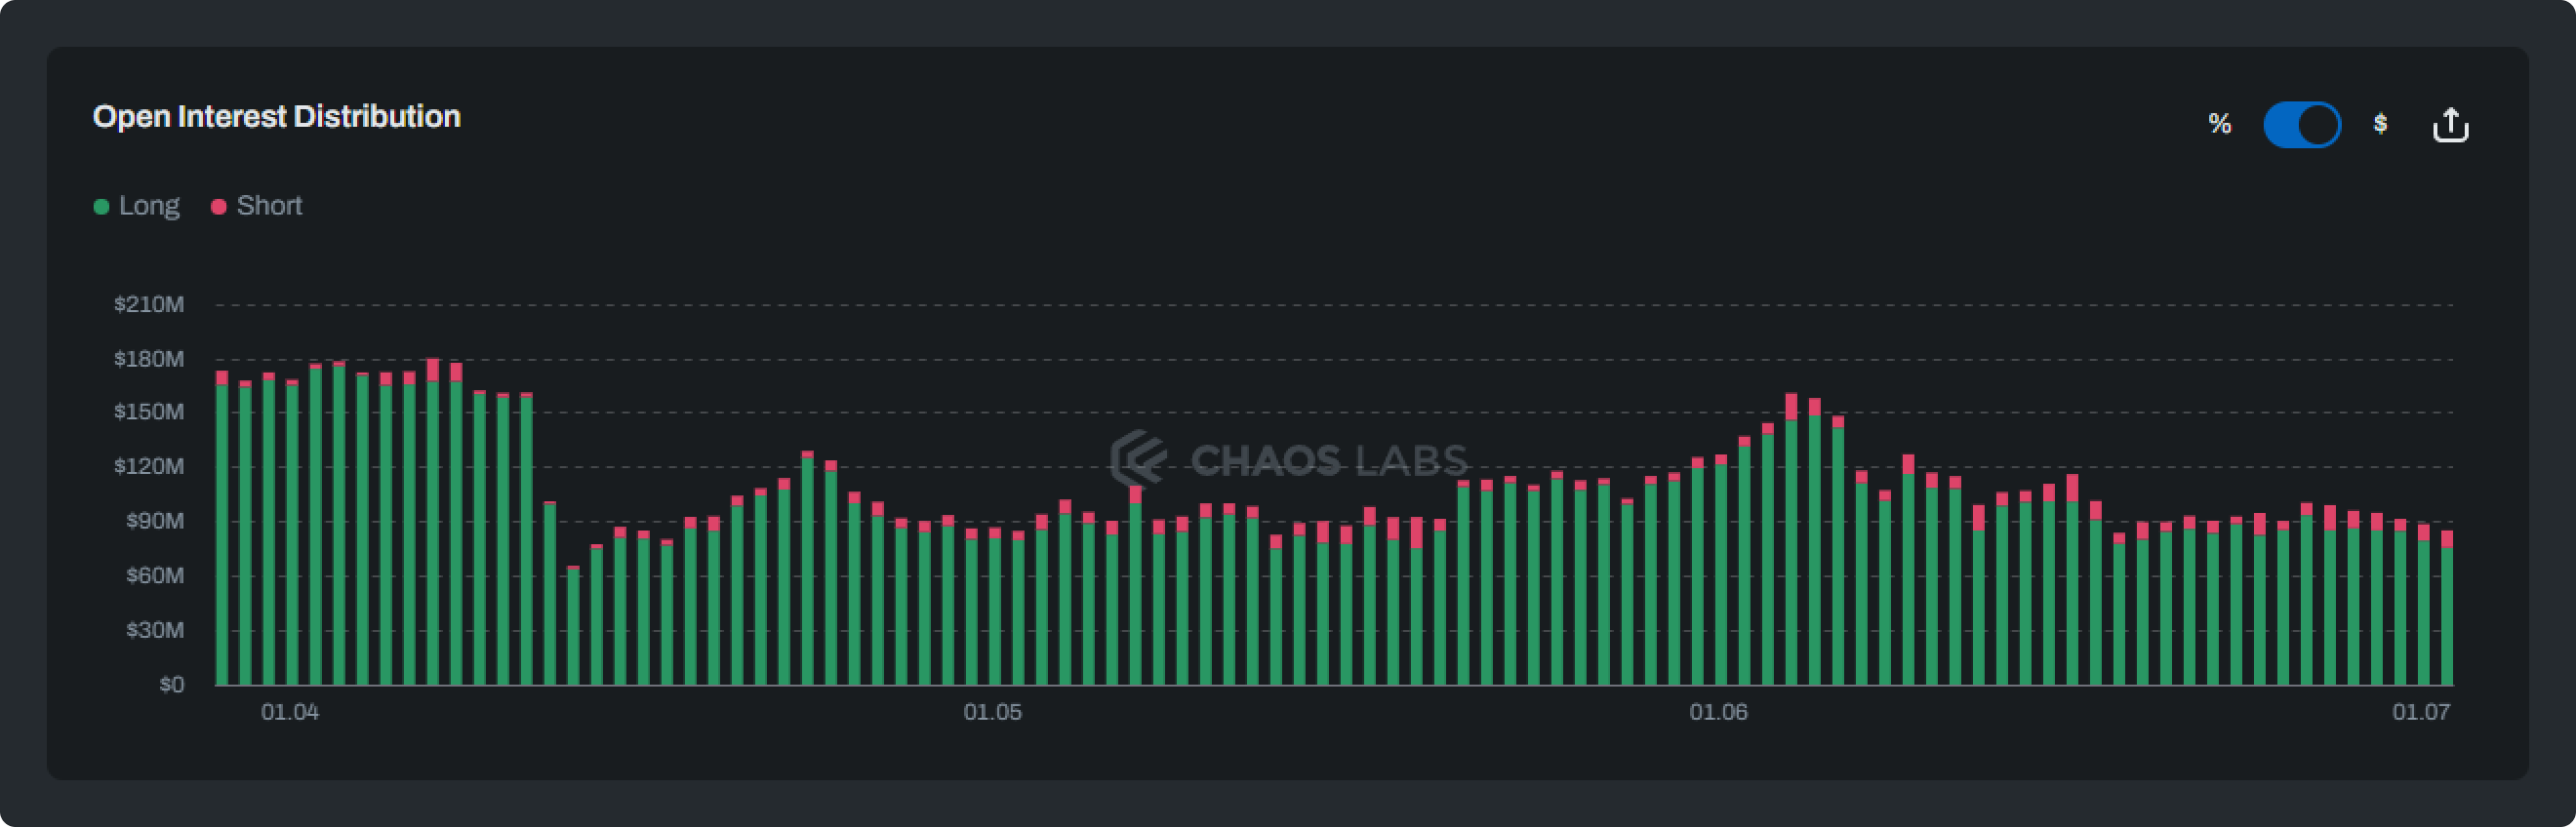
As you scroll down the page, you can see the open interest distribution for that given market, expressed both as a percentage and notional value.
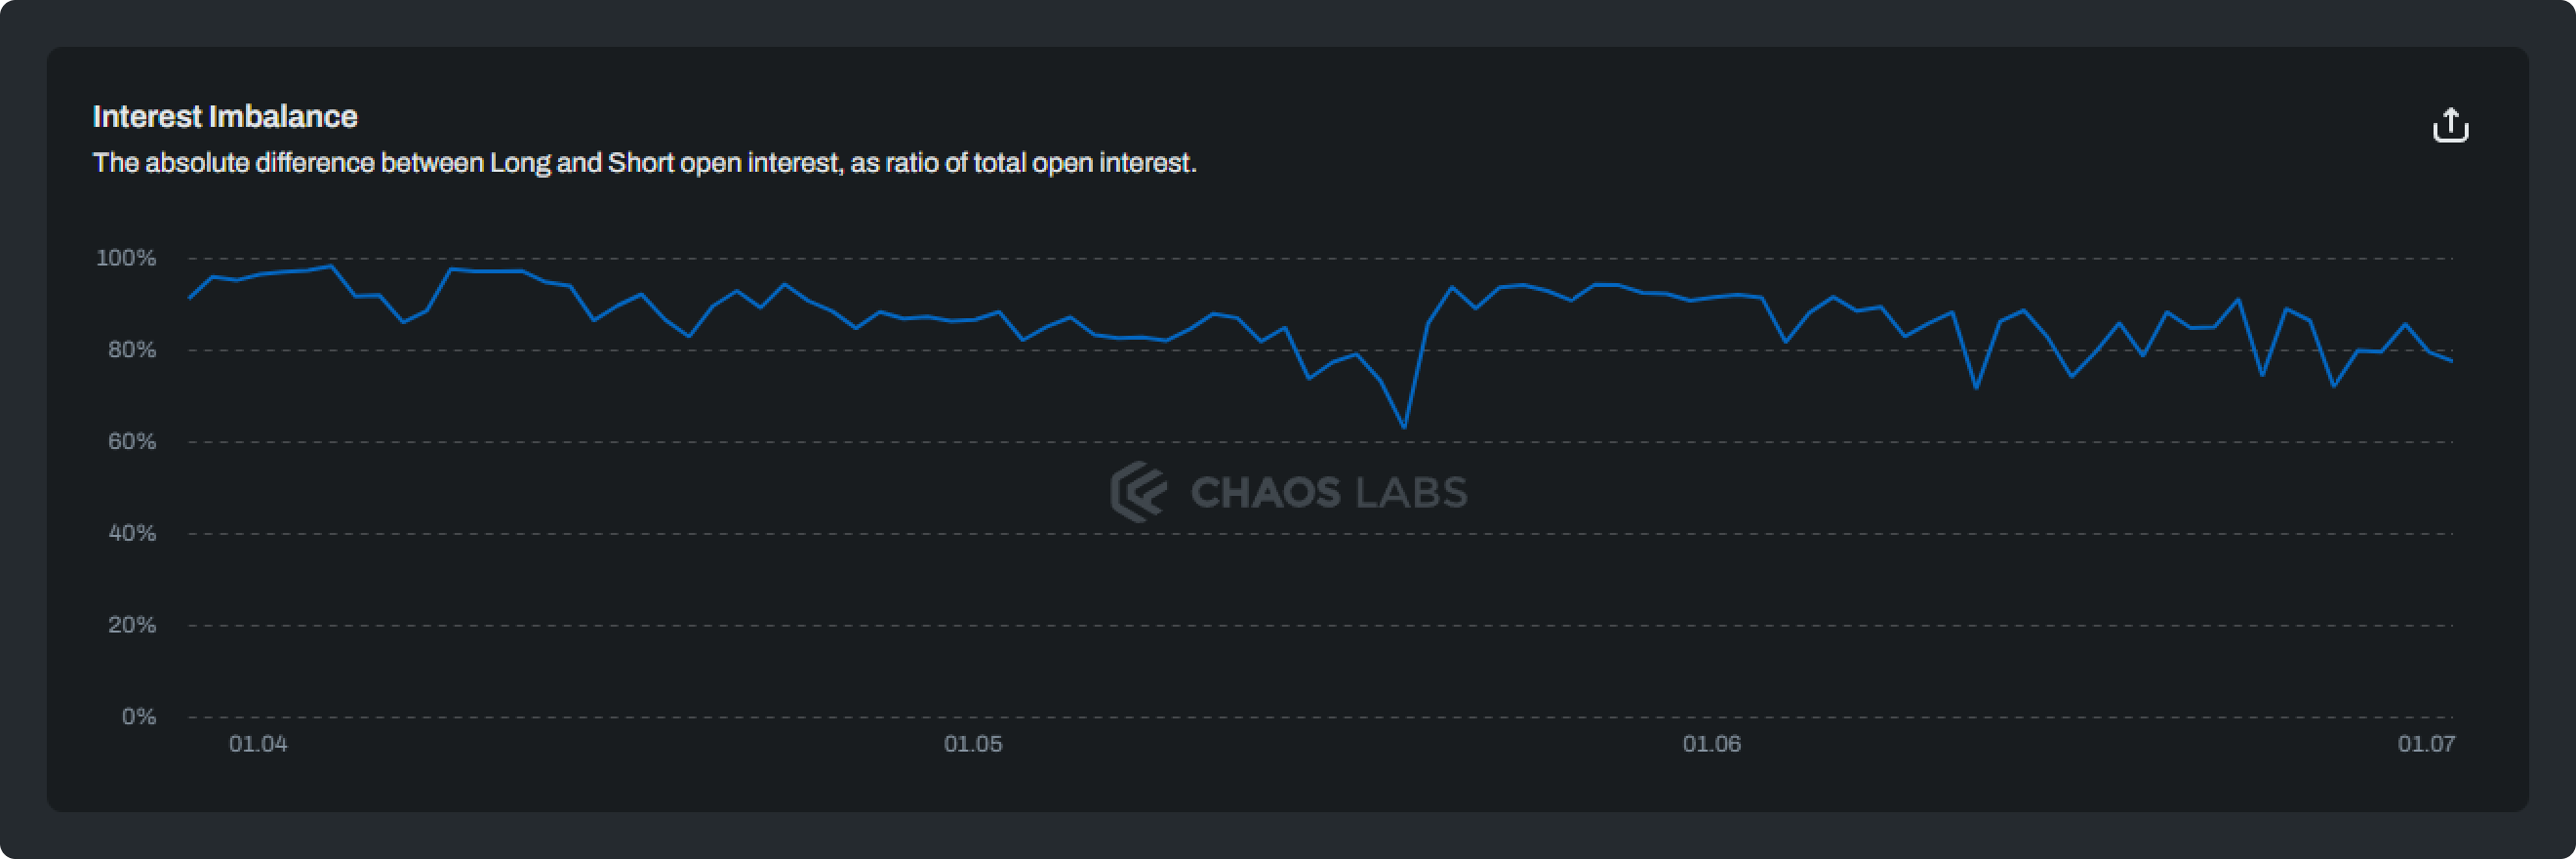
You can see the open interest imbalance; this is the absolute difference between long and short open interest, and is expressed as a ratio of total open interest.
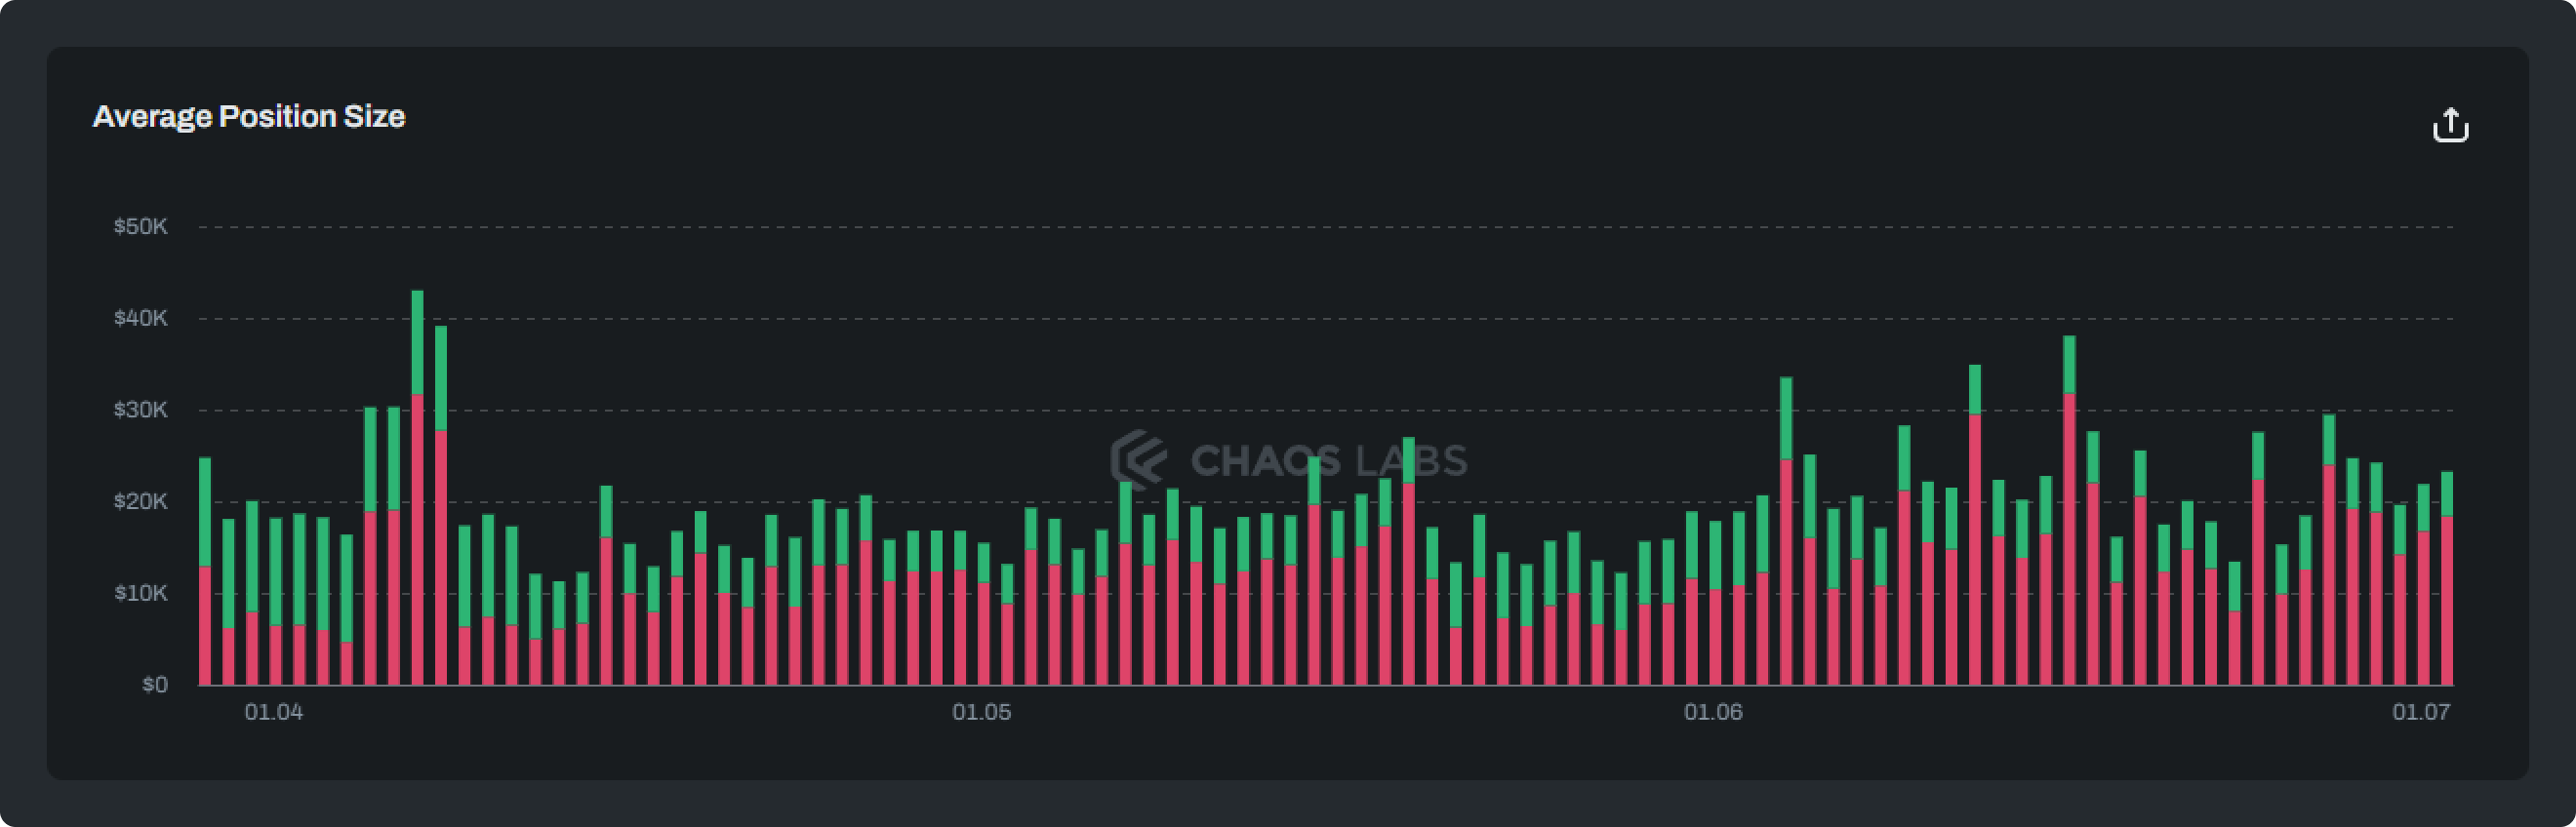
You can see the average position size for the given market.
You can see the cumulative traders’ realized PnL, including fees, from closed positions over time.
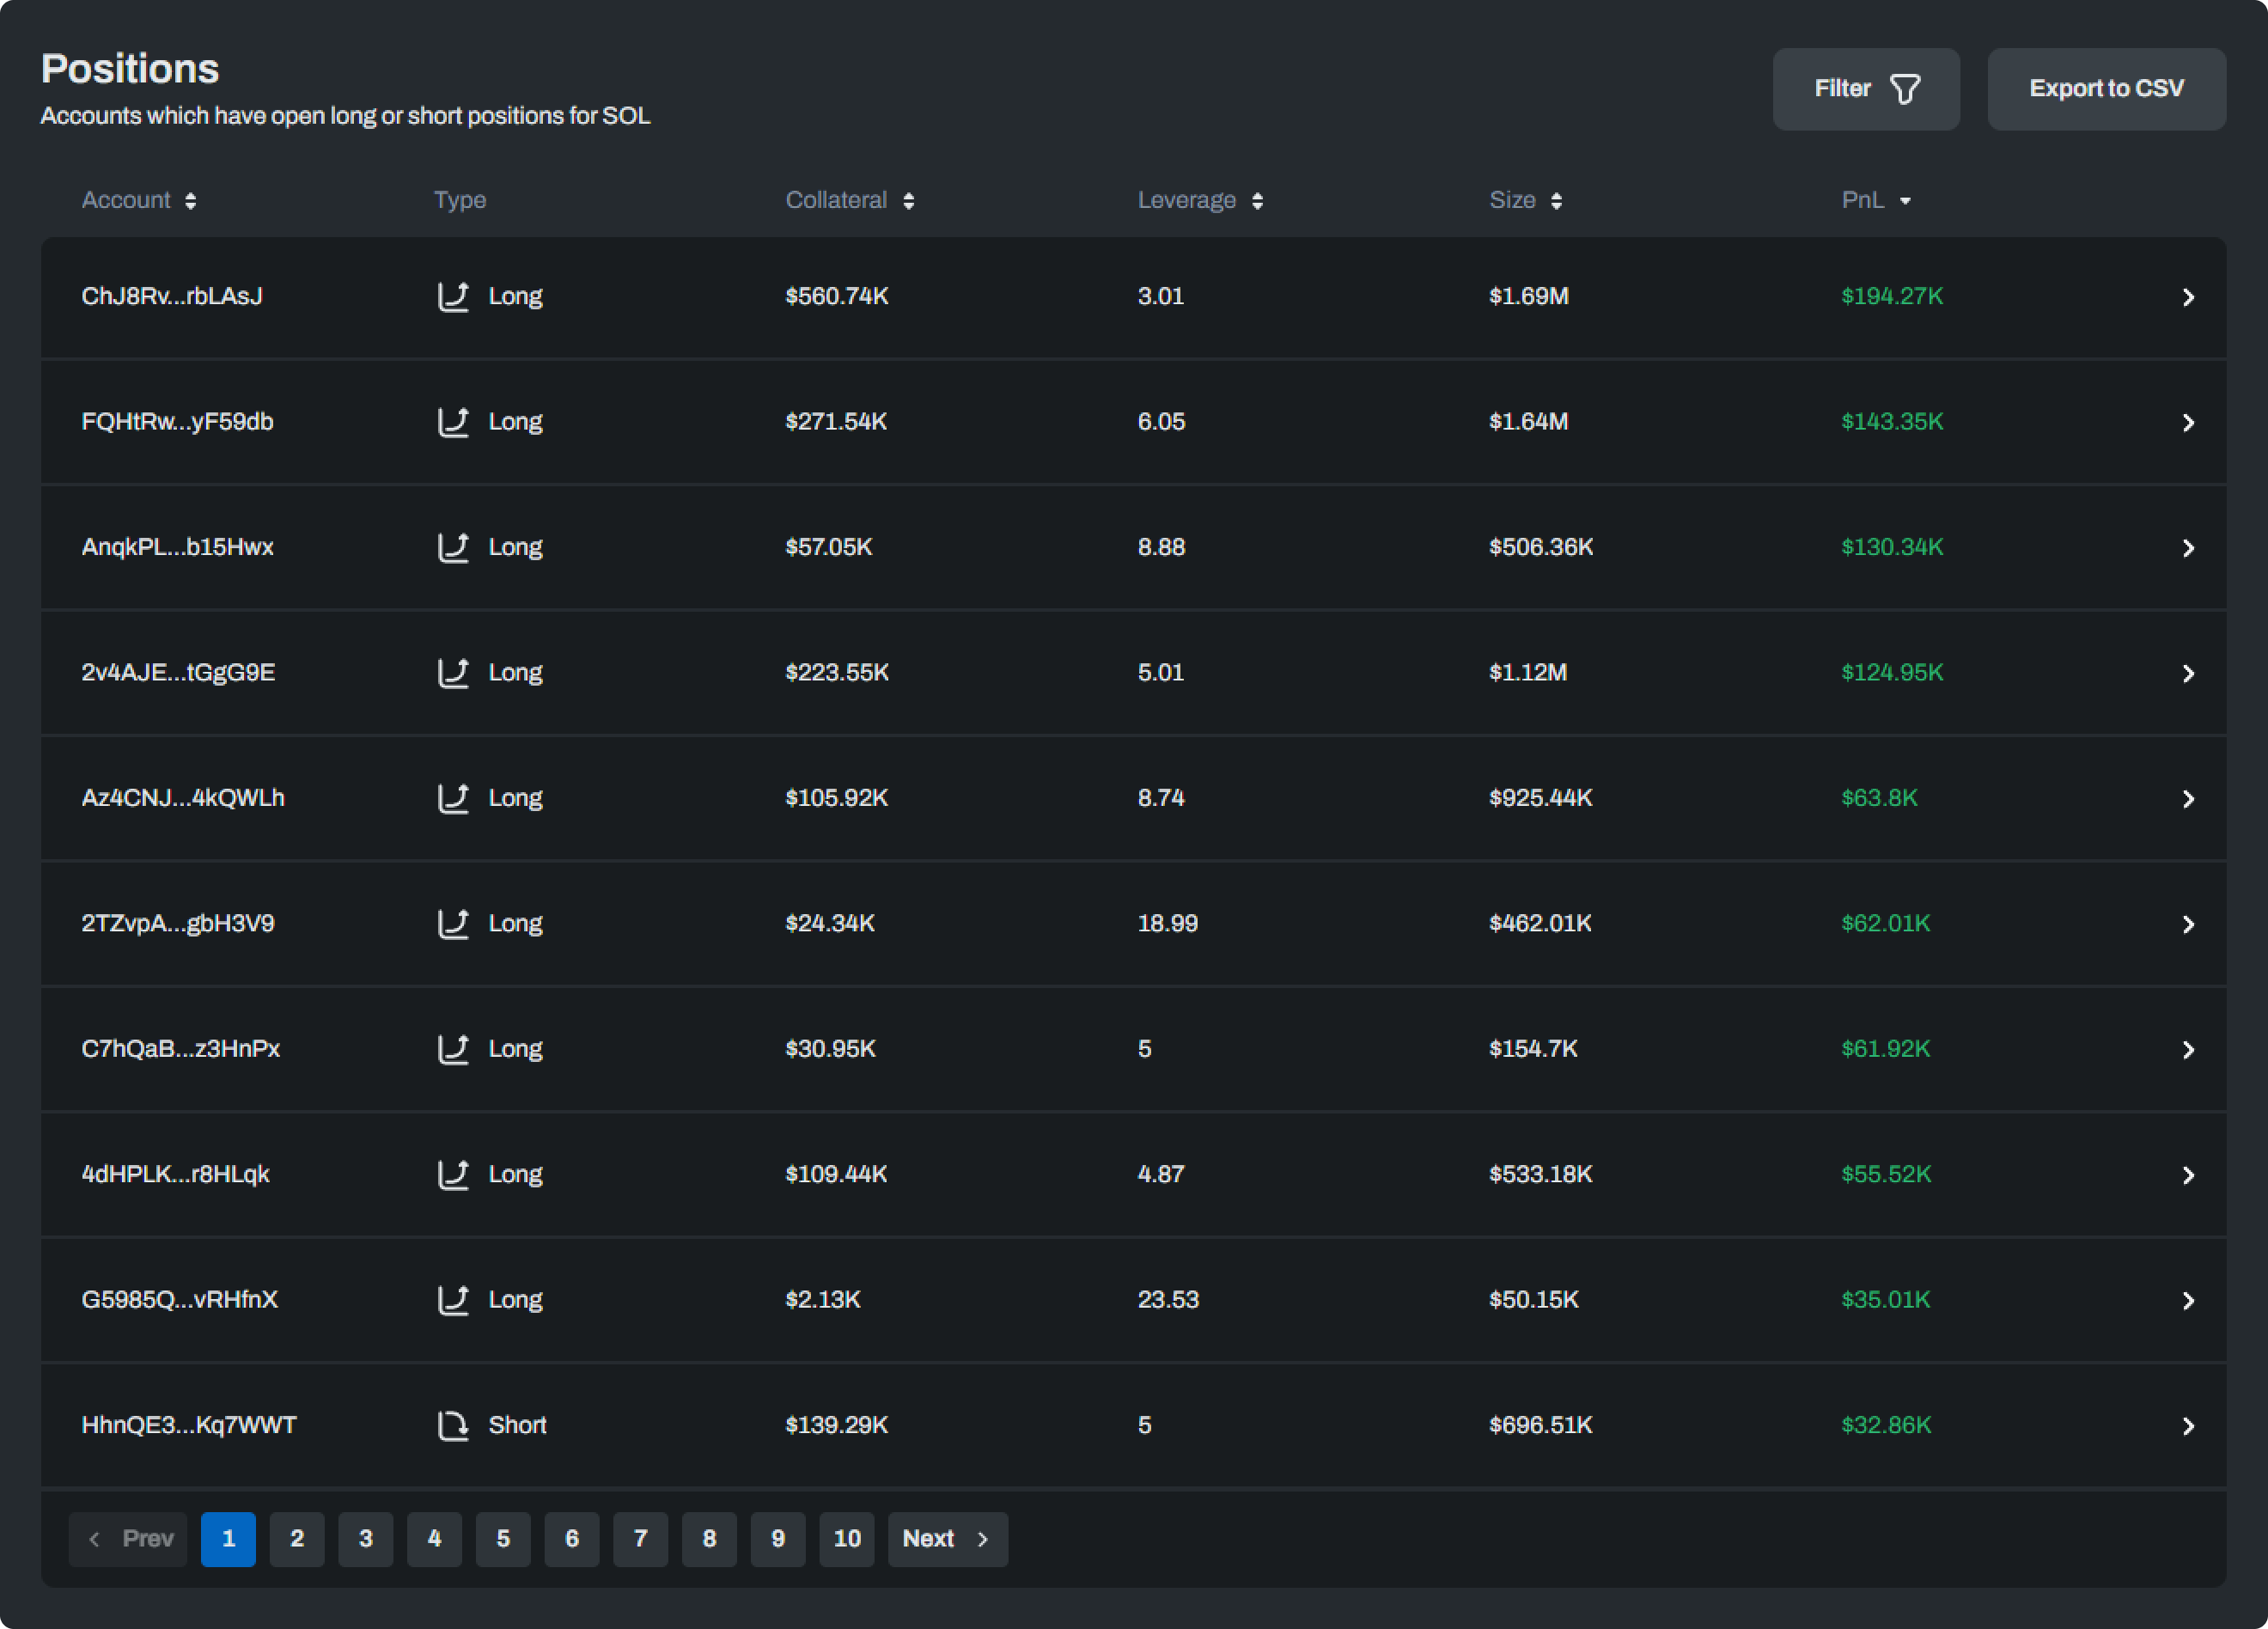
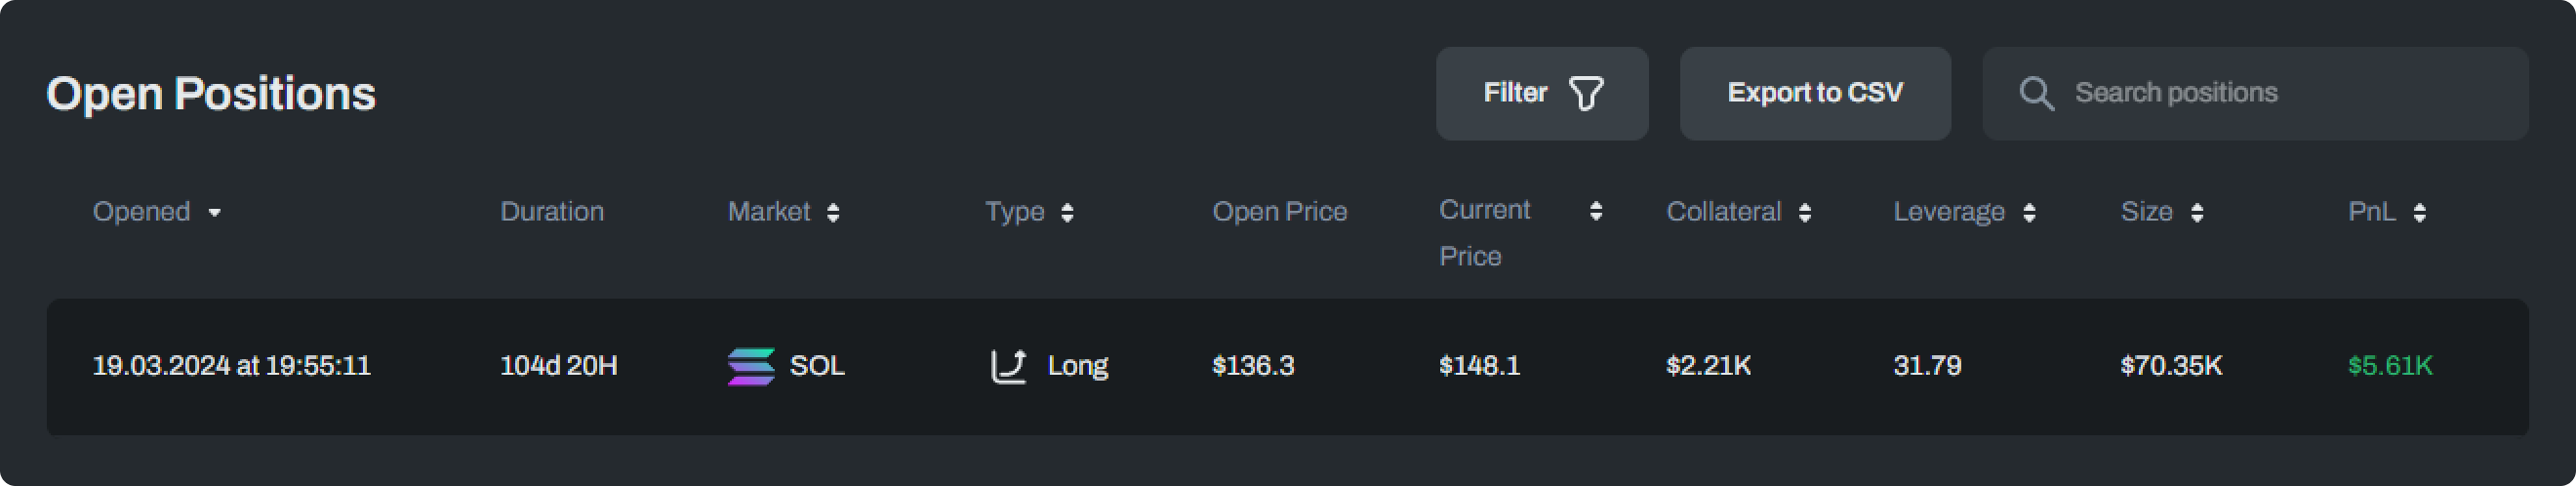
Finally, you can see all the open long and short positions for the given market, with the ability to drill deeper into the specifics of the open position, including the account, trade type, collateral, leverage, trade size, and unrealized PnL. This table enables the real-time monitoring of open positions and can be used to derive insights about current trading activity in the selected market.
Accounts
The third tab links to the Accounts page. This page displays a list of all accounts sorted by Total PnL, Average Size, or any other available fields. It also conveys the assets that the account has historically traded on the platform.
Here, you can derive interesting insights about account activity; for example, the number one ranked account by Total PnL typically opens larger trades with a lower level of leverage compared with the third-ranked account, which does considerably more volume with a higher level of leverage.
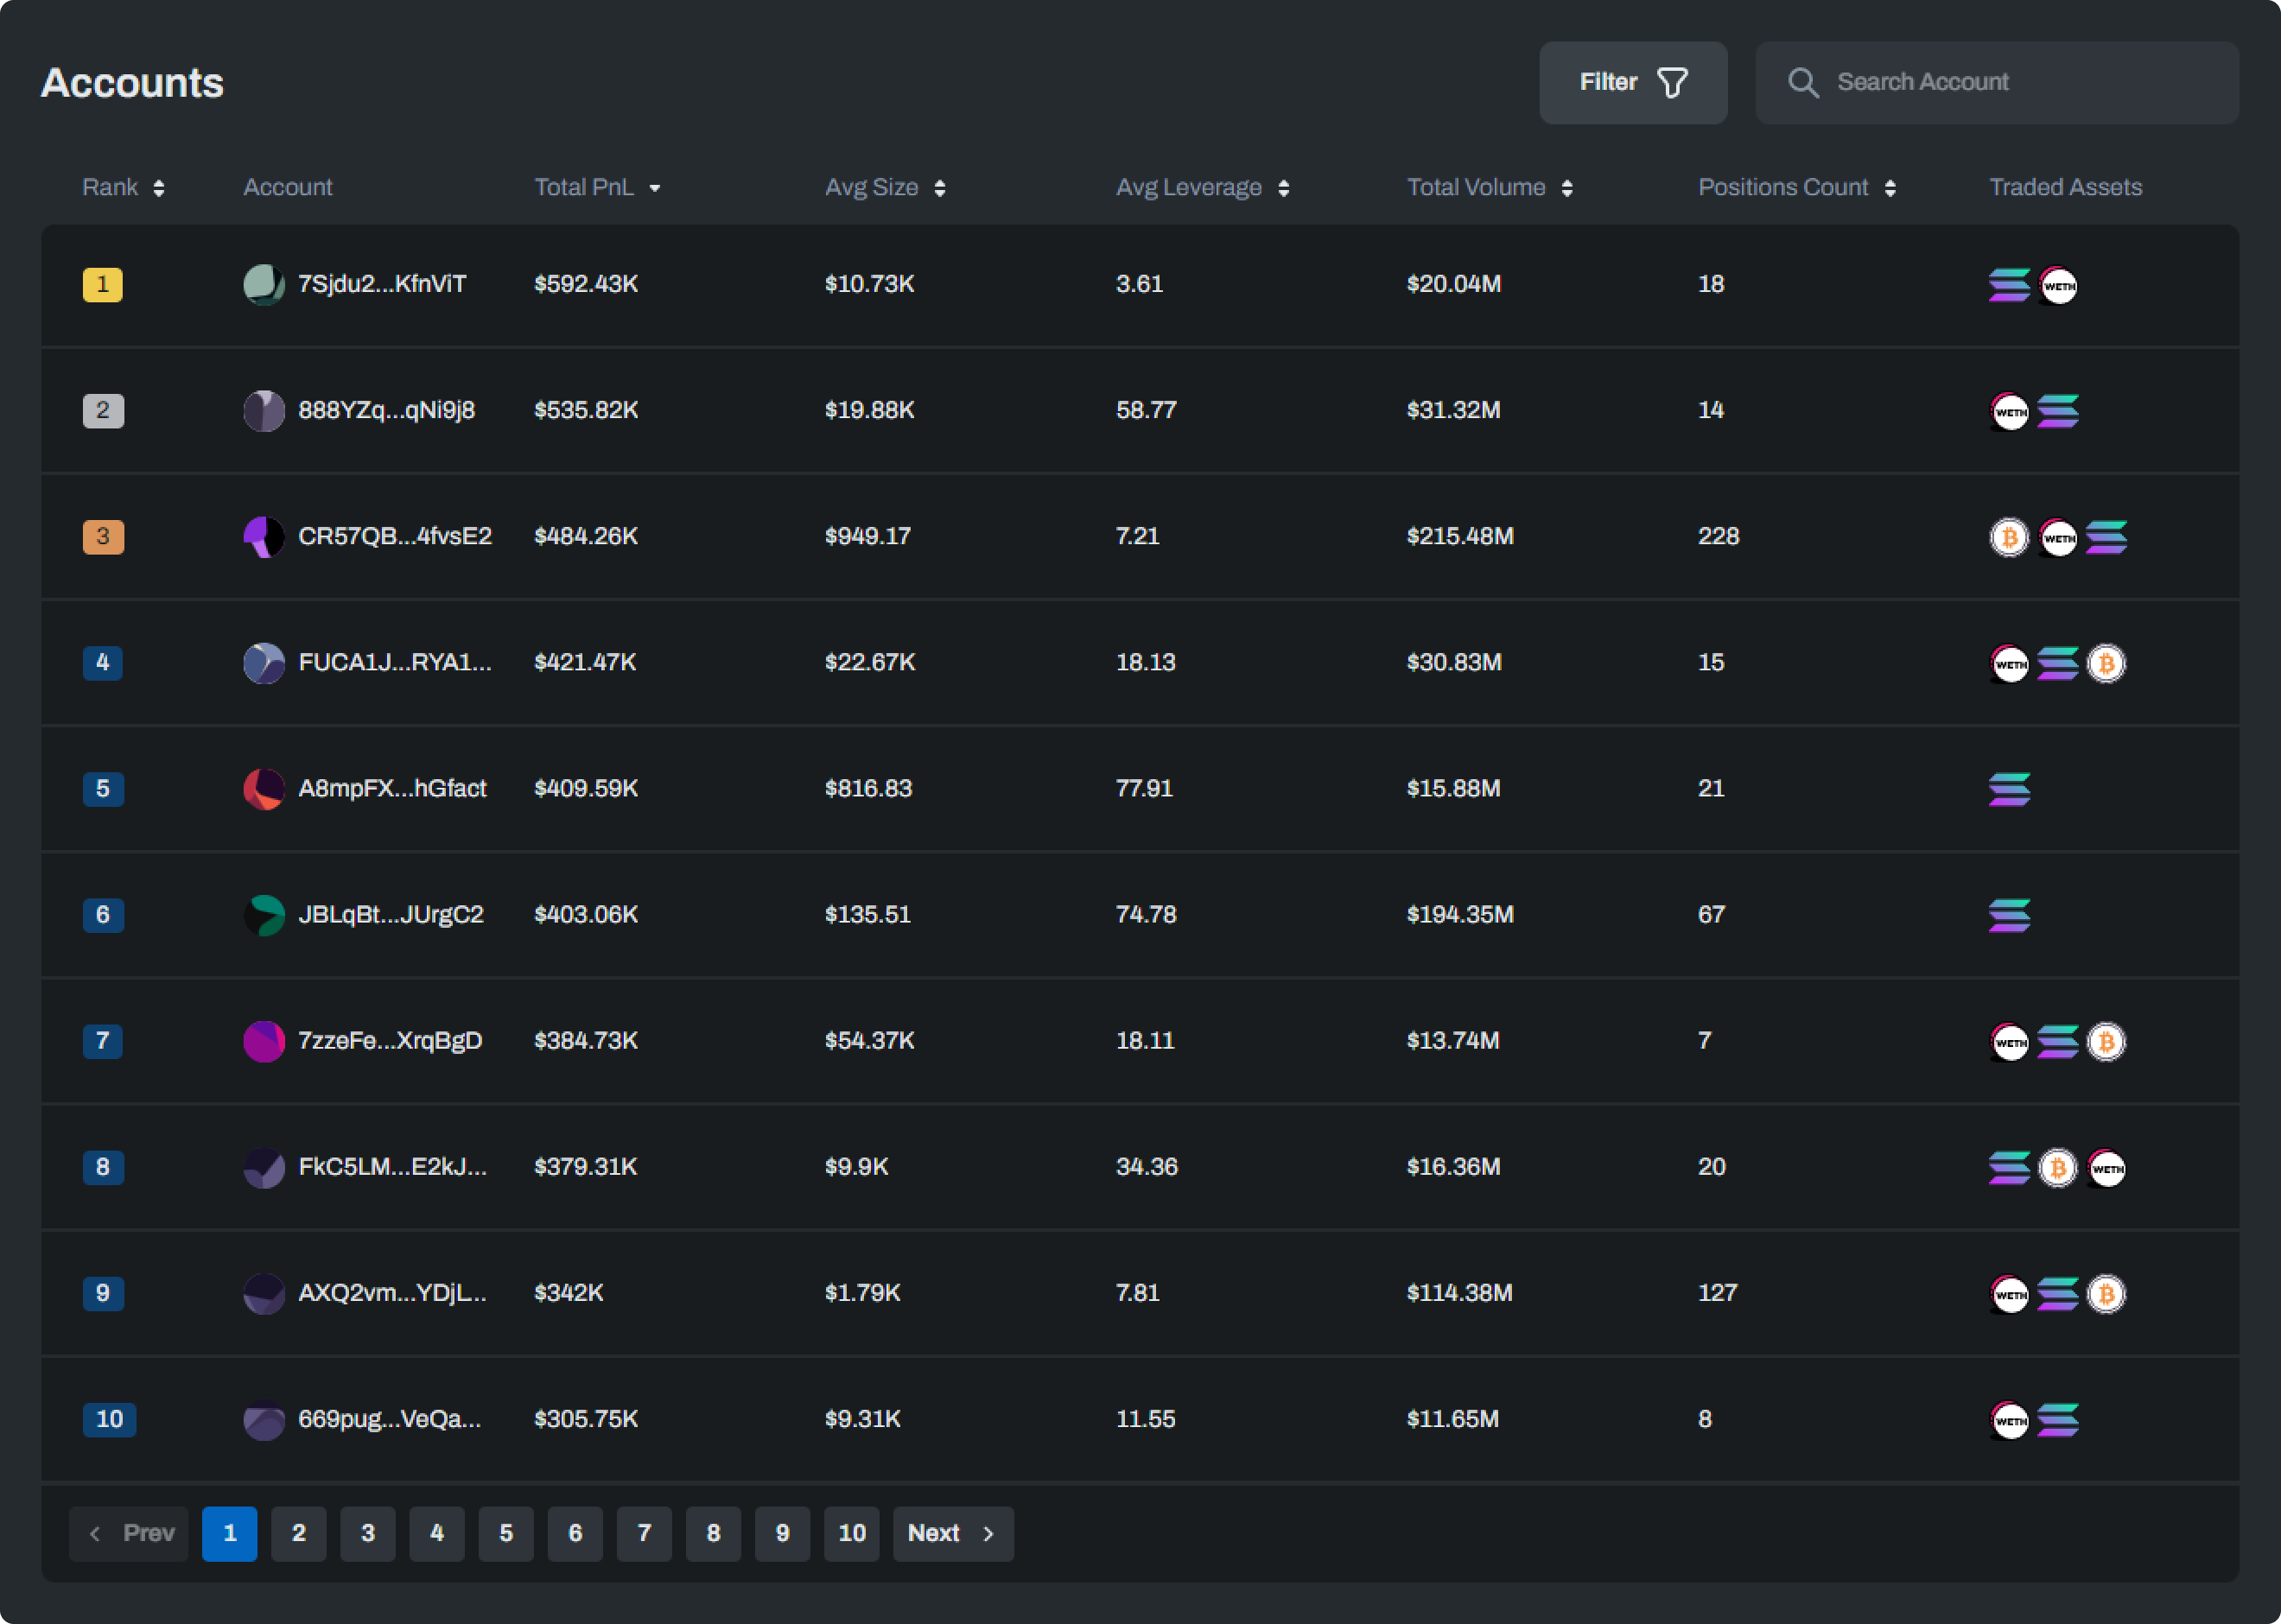
You can even click into a specific account page to access granular details, such as their open and historical positions.
This page simplifies tracking trader activity, whether to identify patterns of suspected traders or to provide an overview of performance for individual traders.

Positions
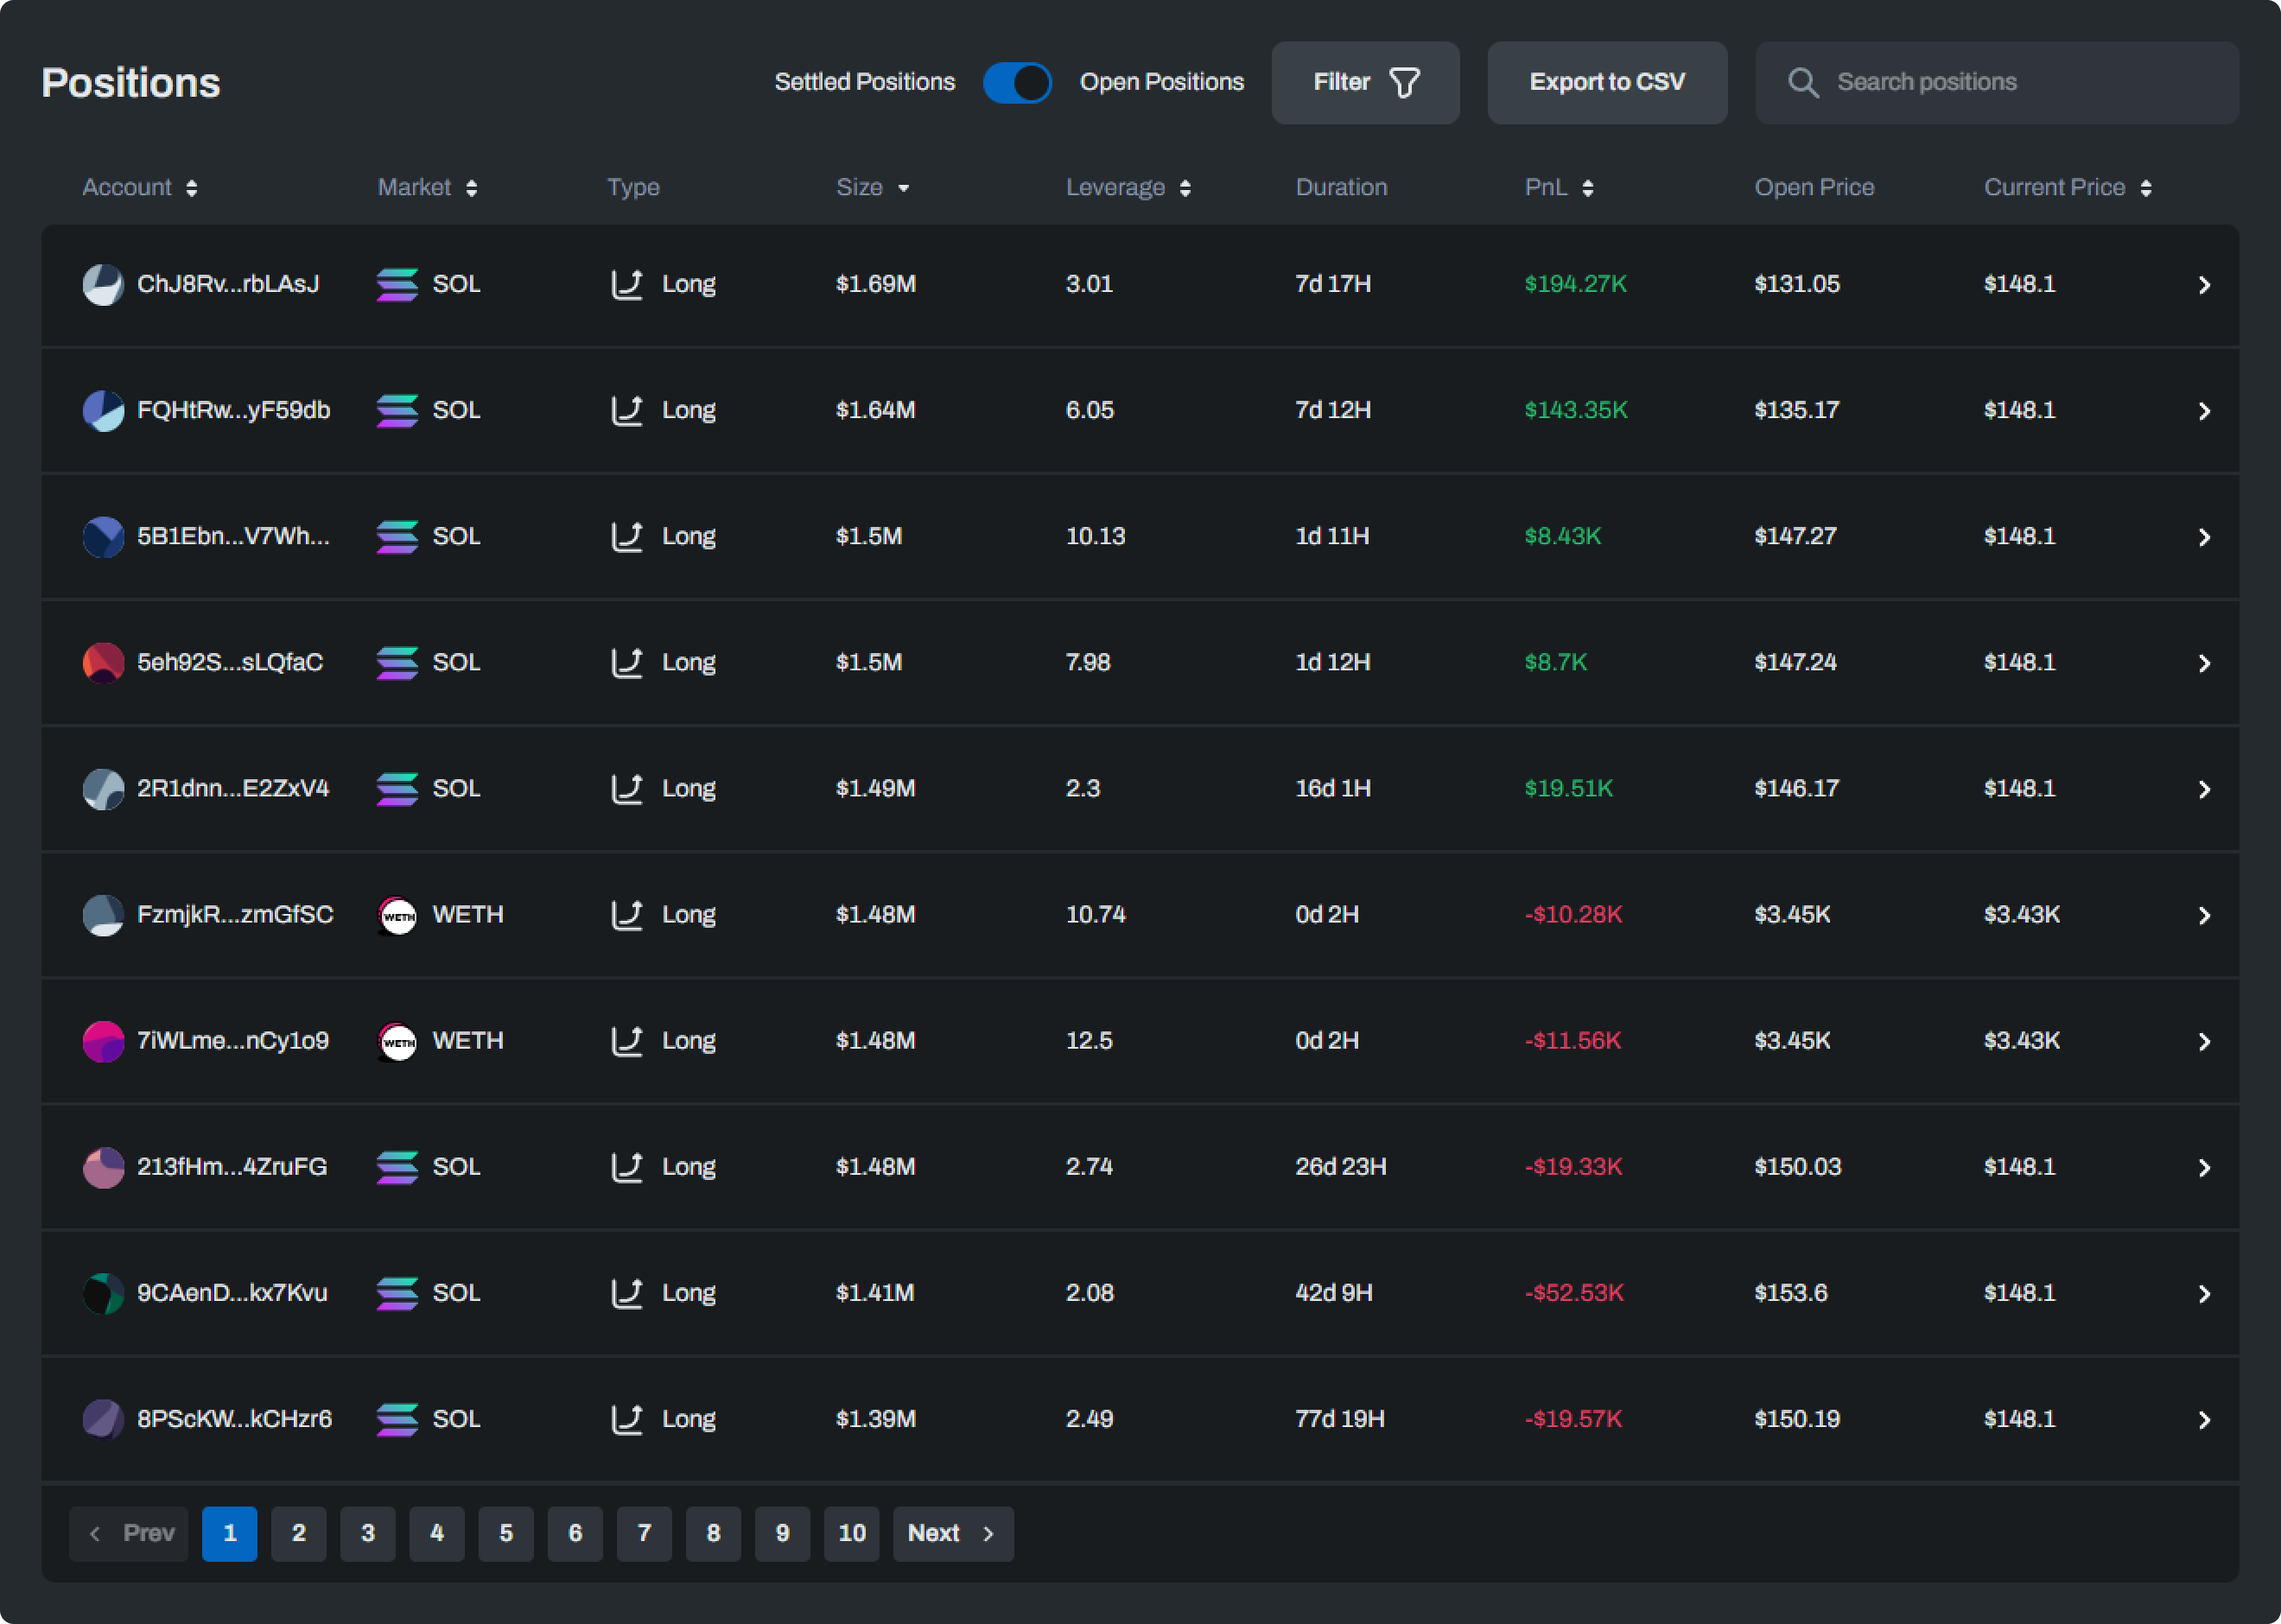
The next tab links to the Positions page. This page displays all settled and open positions, with details about the account, market, trade type, size, leverage, position duration, PnL, and trade prices. This page is useful for tracking individual positions on the Jupiter platform and identifying suspicious trading behaviour. You can filter Positions to refine your search or export this data to a CSV file if needed for analysis.
Liquidations
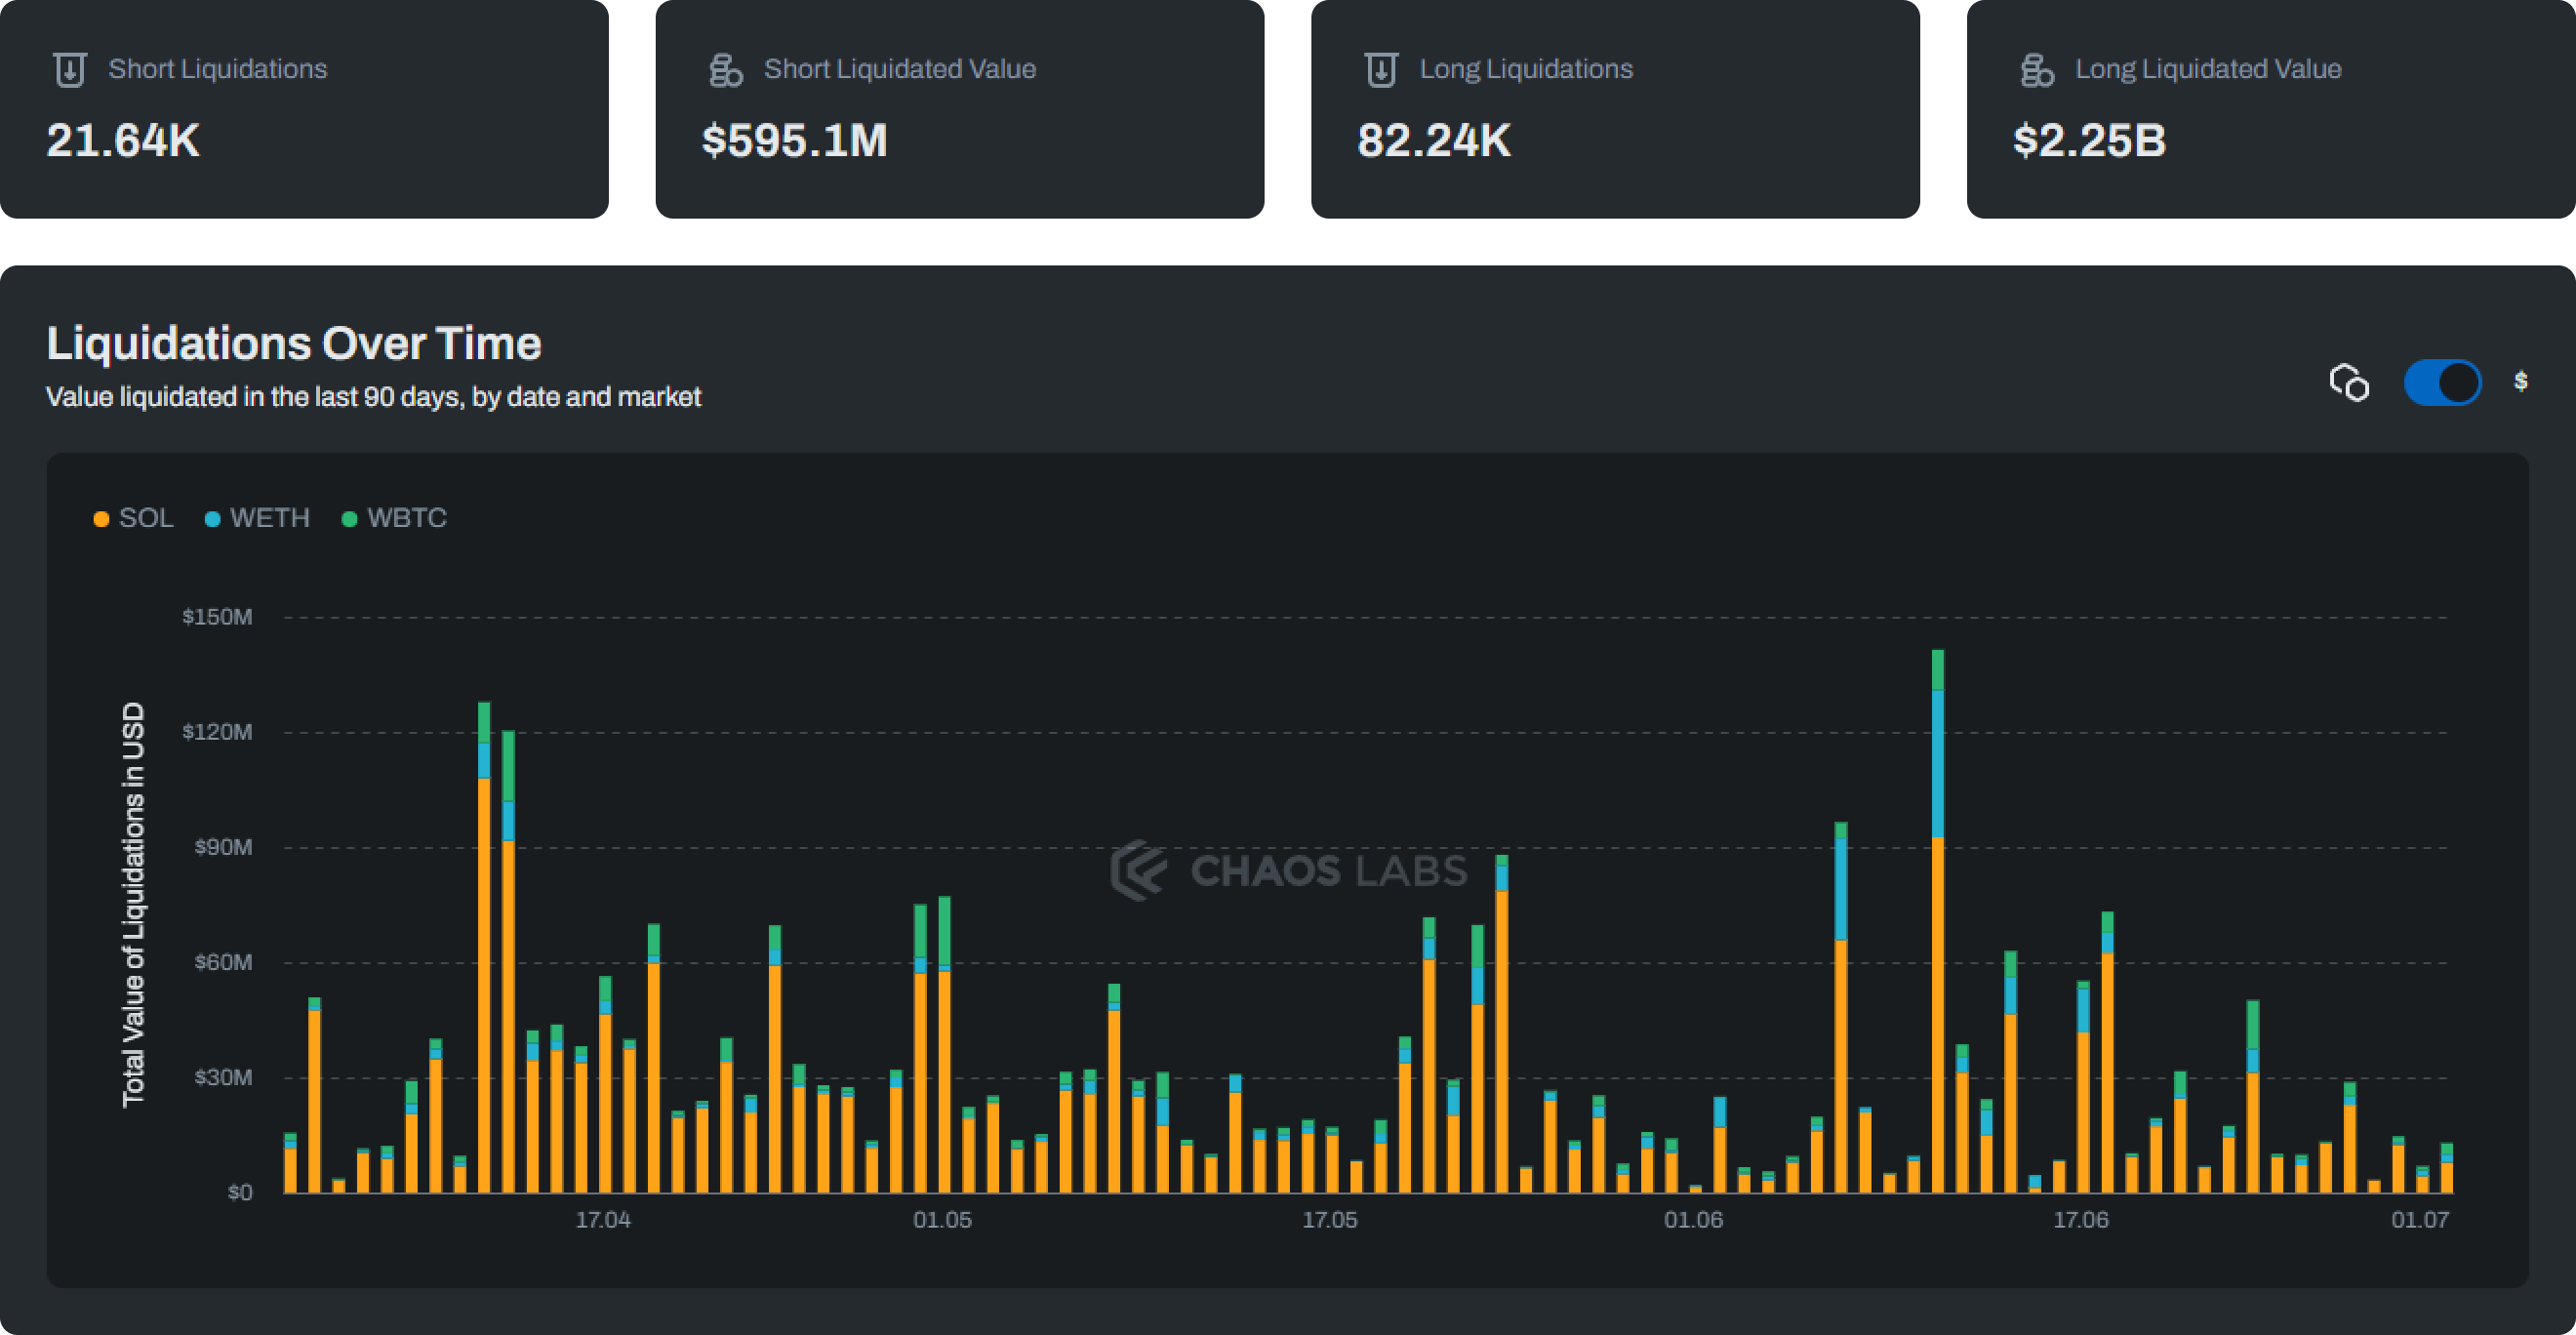
The penultimate tab links to the Liquidations page. This page displays the total number of liquidations and their value for both short and long positions. This information is also broken down by market, so you can observe liquidation events for a particular market in the event of elevated volatility, which is helpful for assessing the platform’s risk exposure.
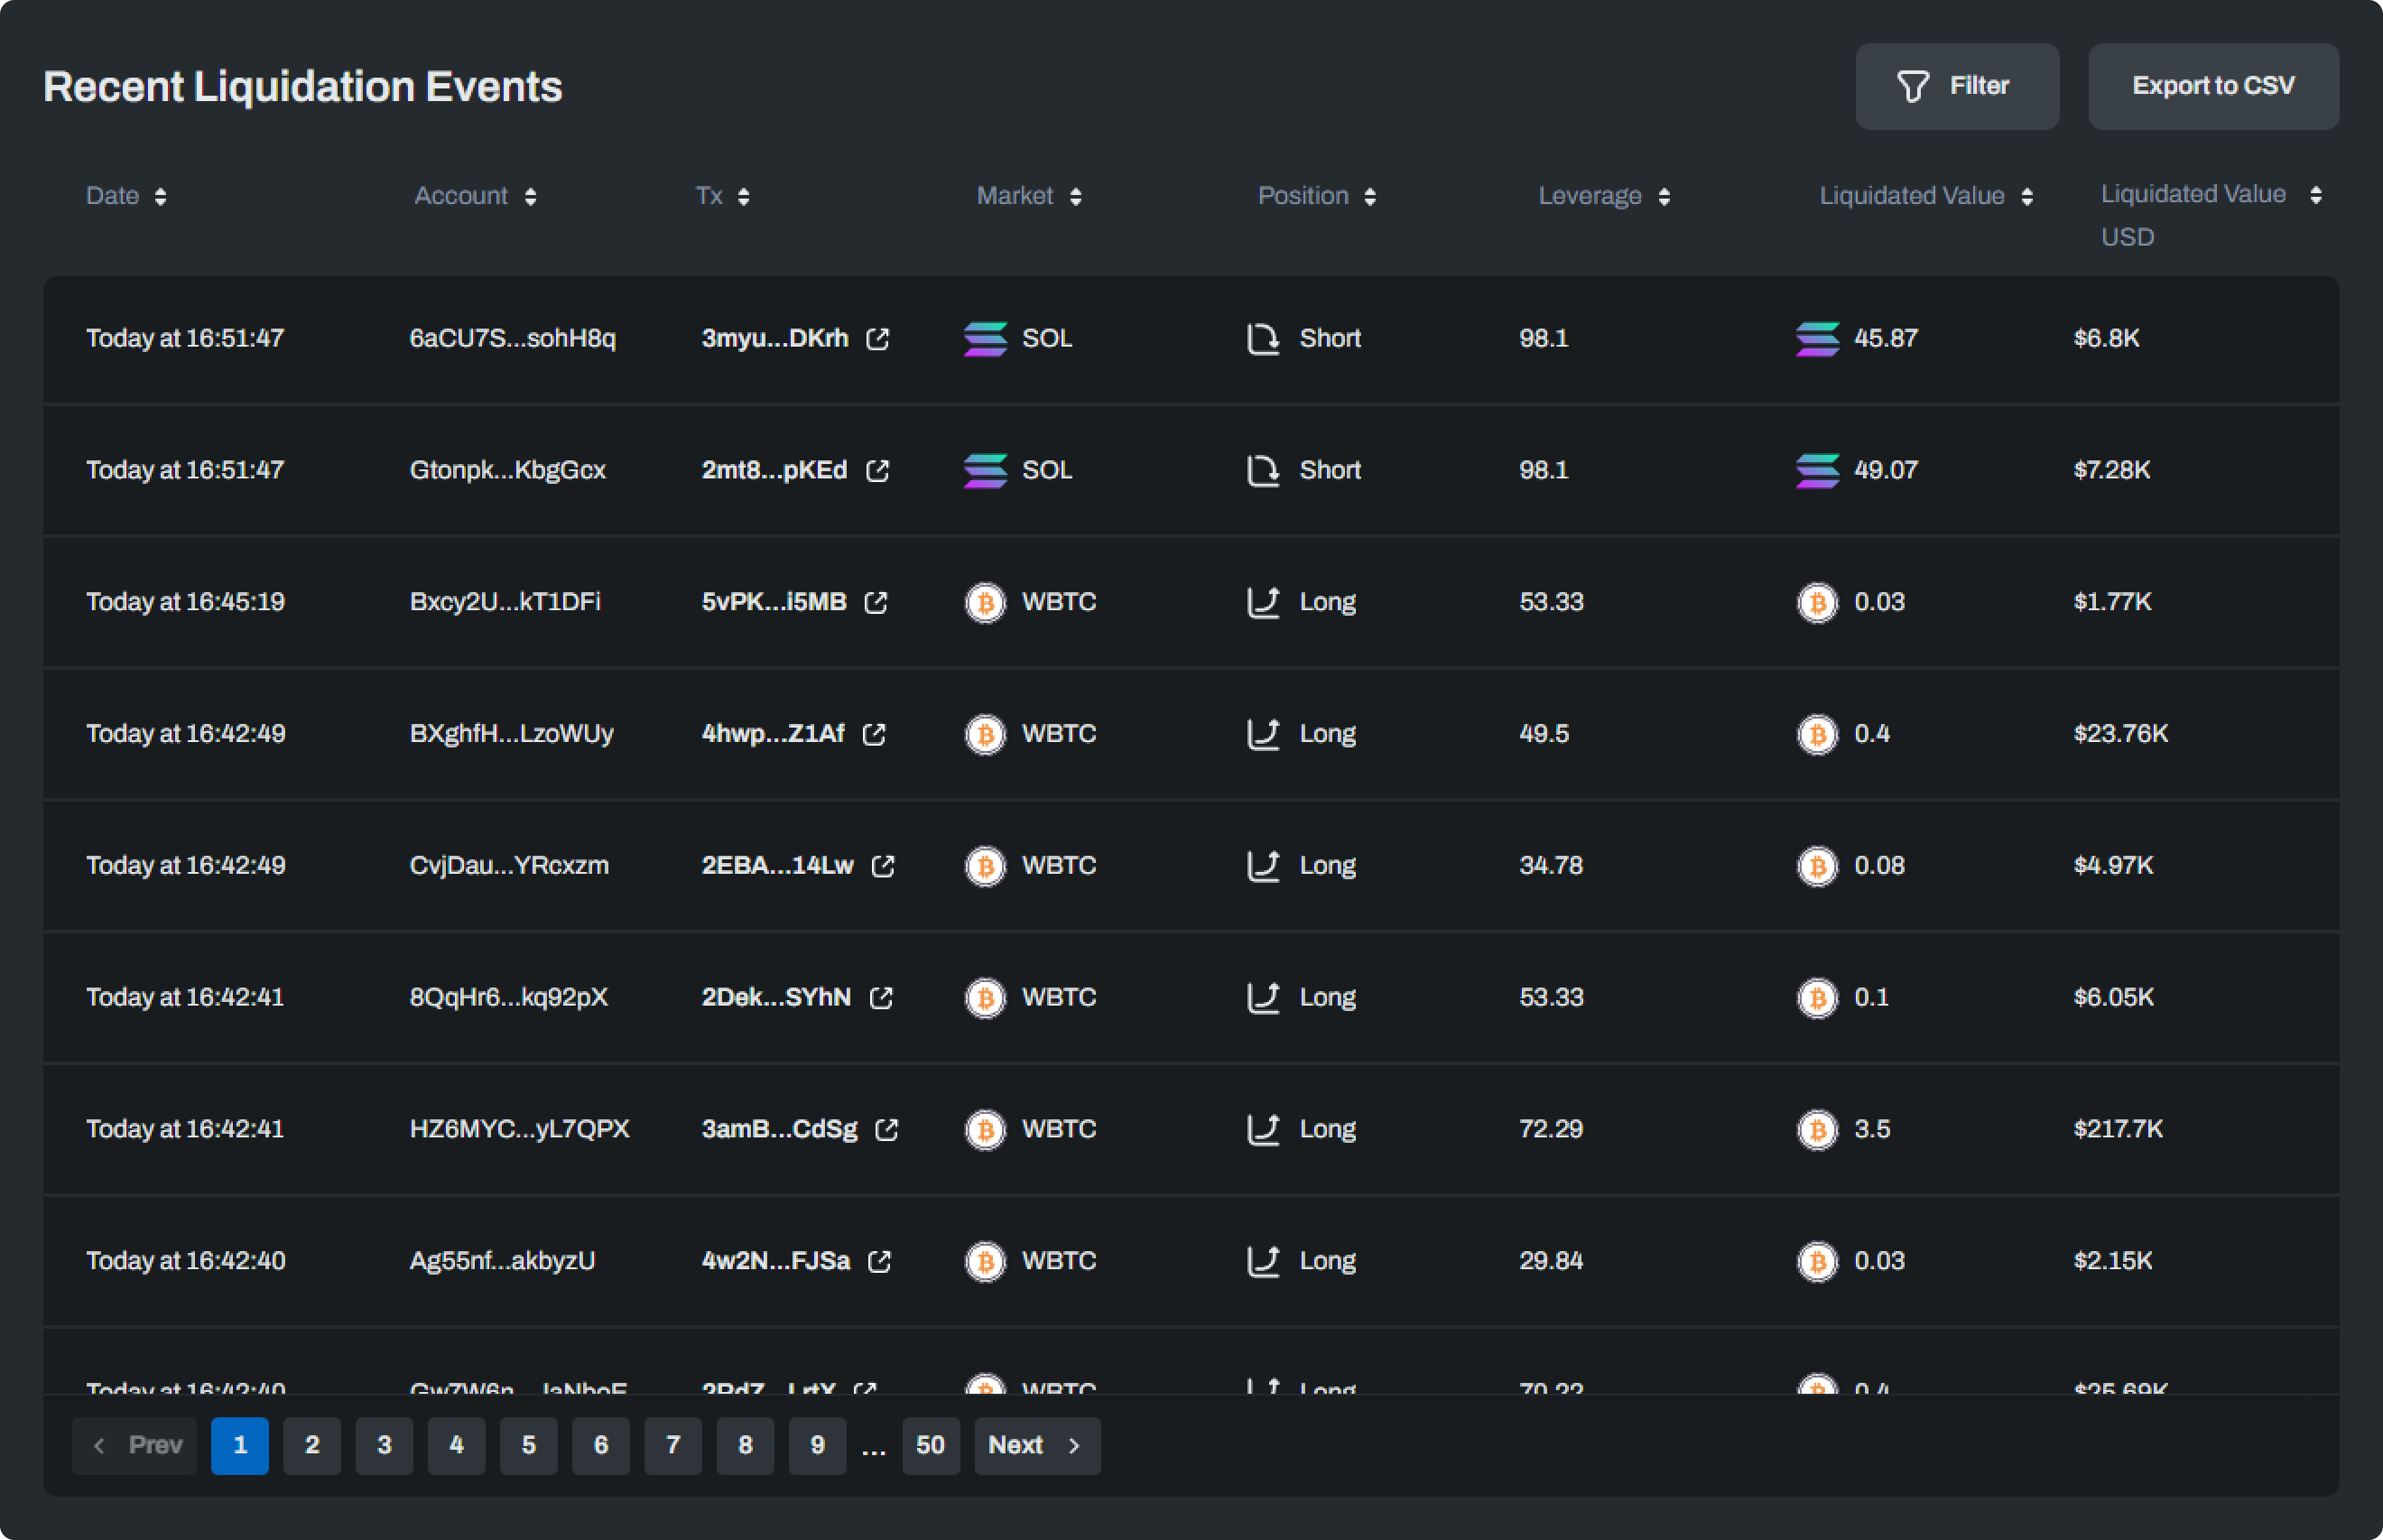
You can also view recent liquidation events and filter them by whichever field interests you most. This data is also exportable as a CSV file.
JLP Pool Page
The final tab links to the JLP Pool page. This page surfaces vital metrics about the JLP Pool, including total value locked (TVL), APR and APY, which extrapolate expected returns for LPs. You can also see the $JLP Total Supply and the $JLP Price.
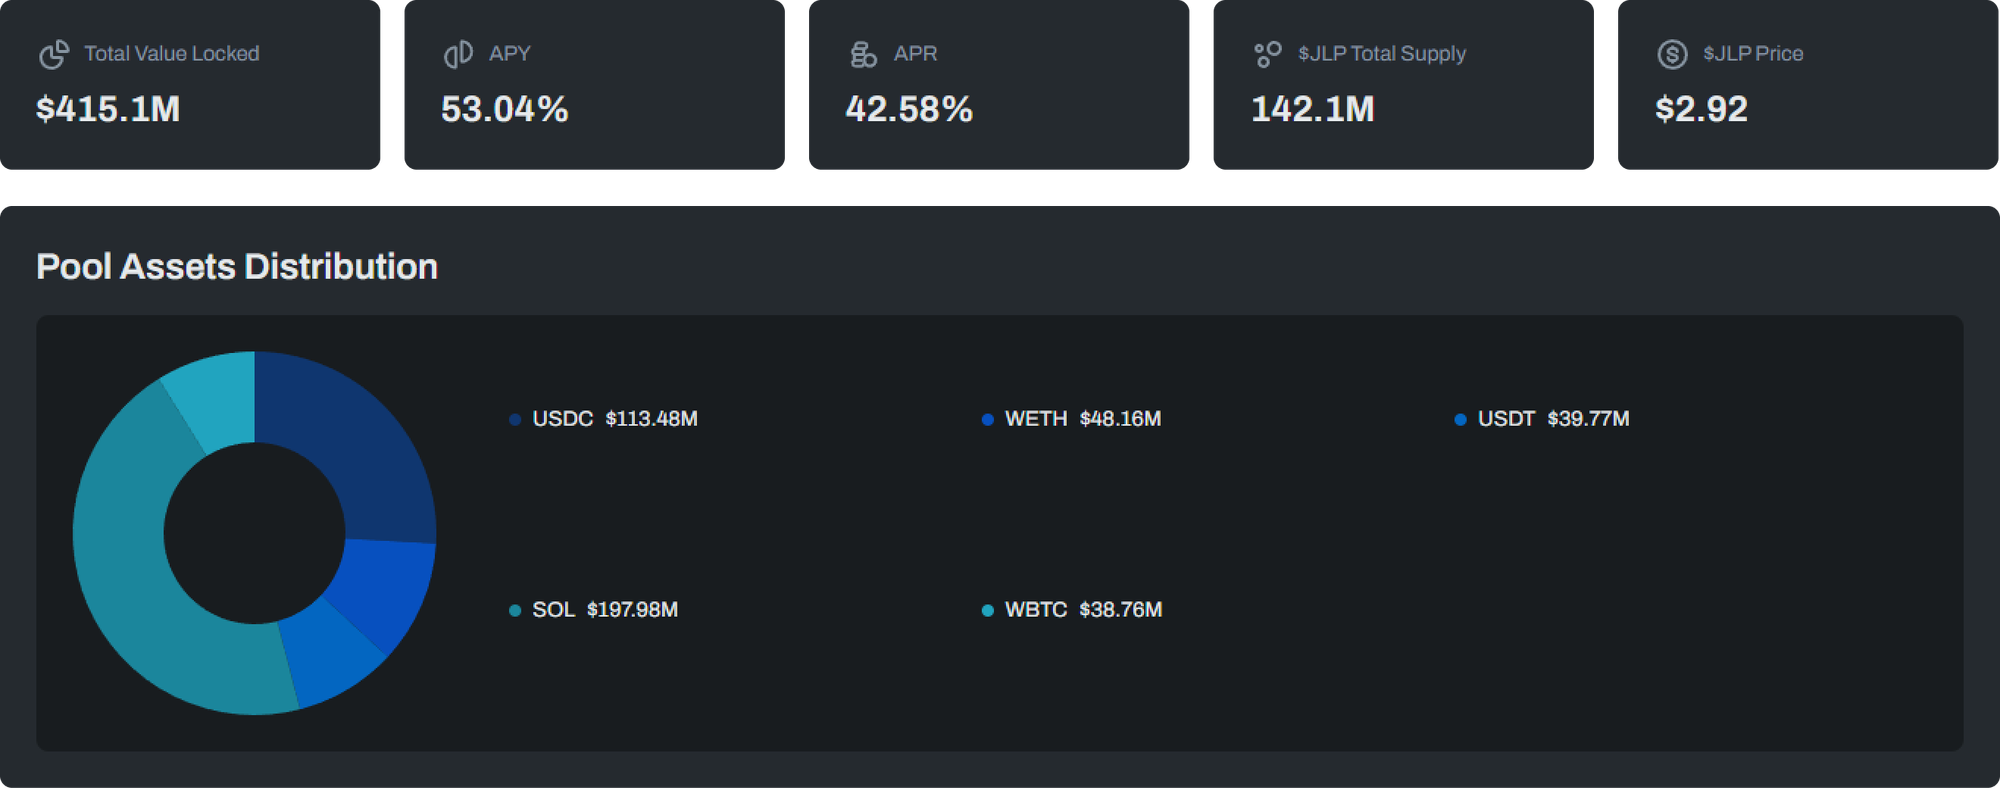
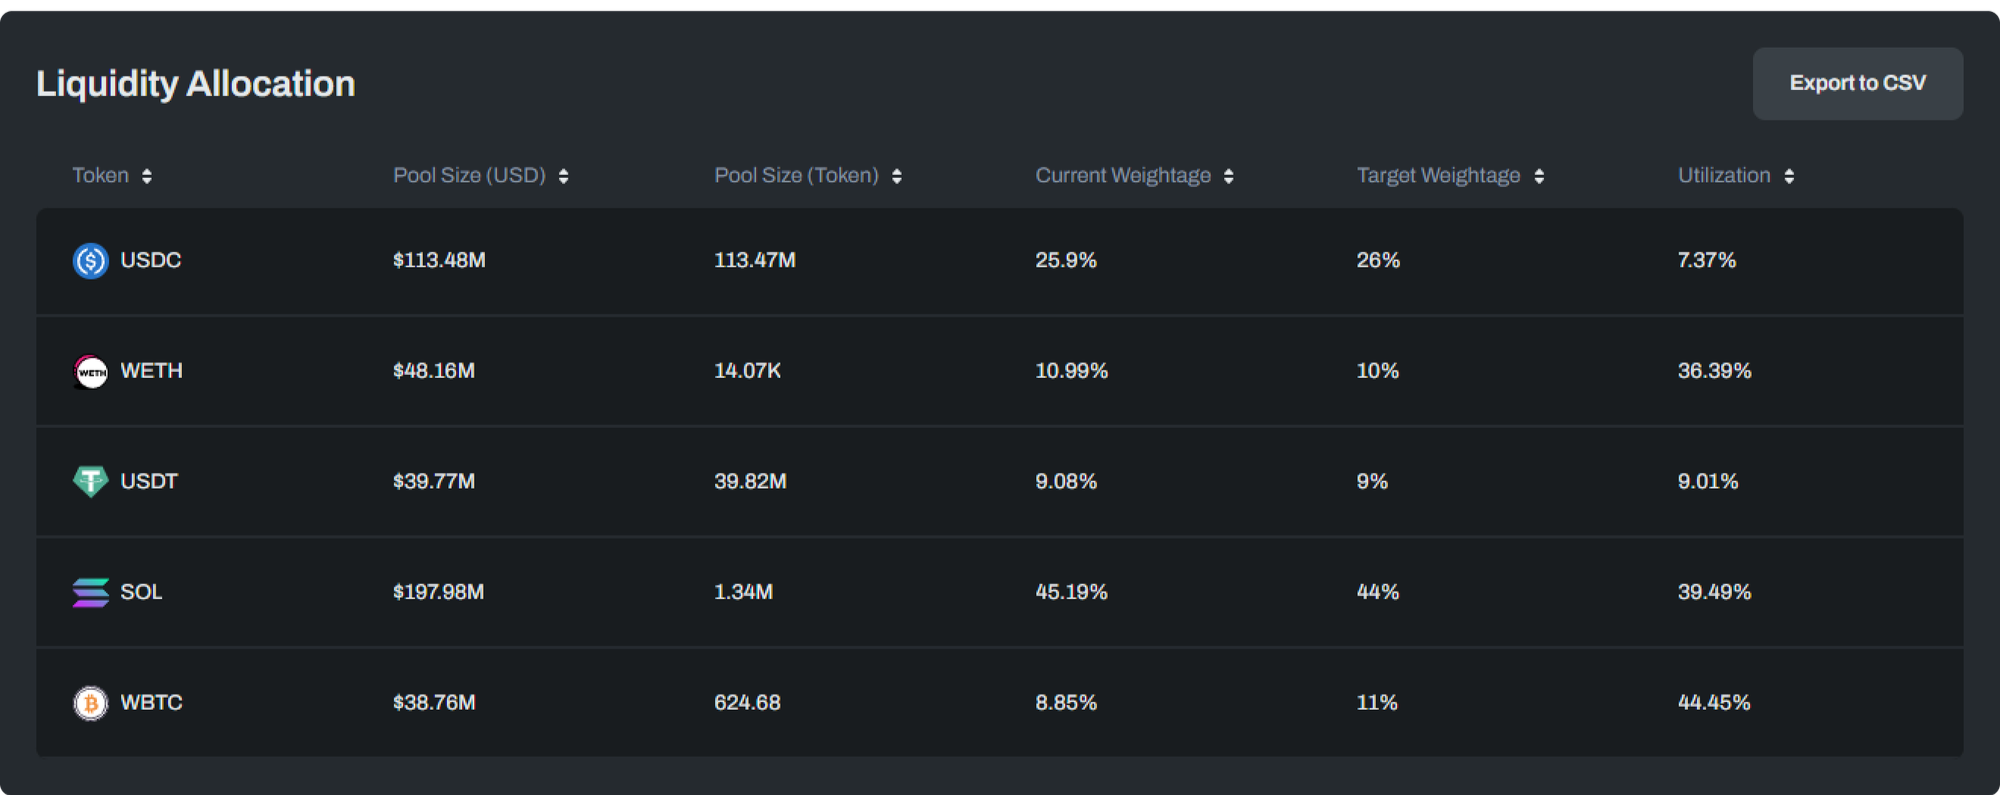
If you scroll to the bottom of the page, you can also view the liquidity allocation by token. This table highlights critical information about the pool distribution. Target weightage represents the desired portion of the pool for each token and is a crucial parameter for the protocol. In contrast, the current weightage reflects the actual allocation. Utilization indicates the usage of each token in long or short leveraged positions. This information is helpful for recommending target weights and determining borrowing rates.
Community Feedback
Launching the Jupiter Risk Monitoring and Alerting platform is an exciting milestone in collaborating with the Jupiter community. We hope this tool empowers the community to make well-informed decisions and promotes visibility over the risk and health of the Jupiter protocol.
Our platform is constantly evolving and growing to meet our users' needs. We invite the Jupiter community to explore the platform and provide feedback using the Contact Us button on the platform header. Your input directly contributes to our ongoing improvement efforts and helps us tailor the platform to better meet your needs.
Arbitrum STIP Risk Analysis | Insights & Key Findings
Over the past 10 weeks, Chaos Labs has performed a deep analysis of three protocols’ STIP programs from a risk and efficiency point of view. This post focuses on aggregating the learnings from these case studies into a consolidated review to help delegates and protocols improve their decision-making in the future.
Chaos Labs Partners with ether.fi
Chaos Labs is thrilled to announce our strategic partnership with ether.fi, the number one restaking protocol in DeFi
Risk Less.
Know More.
Get updates on our research, product, and launch.