Chaos Labs Oracle Risk Portal
Table of Contents
Chaos Labs is excited to announce the Oracle Risk Portal launch.
In the rapidly evolving landscape of DeFi, the accuracy and reliability of oracles—services that fetch real-world data and bring it onto the blockchain—are paramount. Oracles play a pivotal role in DeFi infrastructure by bridging off-chain realities and on-chain actions. They ensure that applications in the DeFi space can operate based on trustworthy data, thereby influencing critical transitions in application states, such as adjustments in user health scores that may lead to liquidations.
However, the realm of crypto markets, particularly for assets with smaller market caps, is marred by inefficiencies and the inherent immaturity of crypto markets. These discrepancies are often exacerbated by the latency built into oracle architectures. Such variances in data can lead to significant vulnerabilities, exposing DeFi applications and their users to a plethora of risks.
Acknowledging the criticality of these challenges, Chaos Labs has identified a pressing need within the DeFi community to comprehensively understand the scope and severity of risks posed by oracle discrepancies and latencies. To address this need, we introduce the Oracle Risk Portal. This portal is designed to offer an accessible, high-level overview of oracle performance across the DeFi ecosystem, enabling stakeholders to assess and compare deviations in oracle data efficiently.
This documentation will guide you through the features of the Oracle Risk Portal, ensuring that you can leverage this tool to its fullest potential in navigating the complexities of oracle-related risks in DeFi.
Portal Deep Dive
Price Feeds Page
The Price Feeds page provides a listing of crypto asset prices relative to the USD. Each listing shows an asset symbol, the median price in USD across providers, and the number of providers contributing to the price feed. Users can filter assets by name, price, or number of providers.
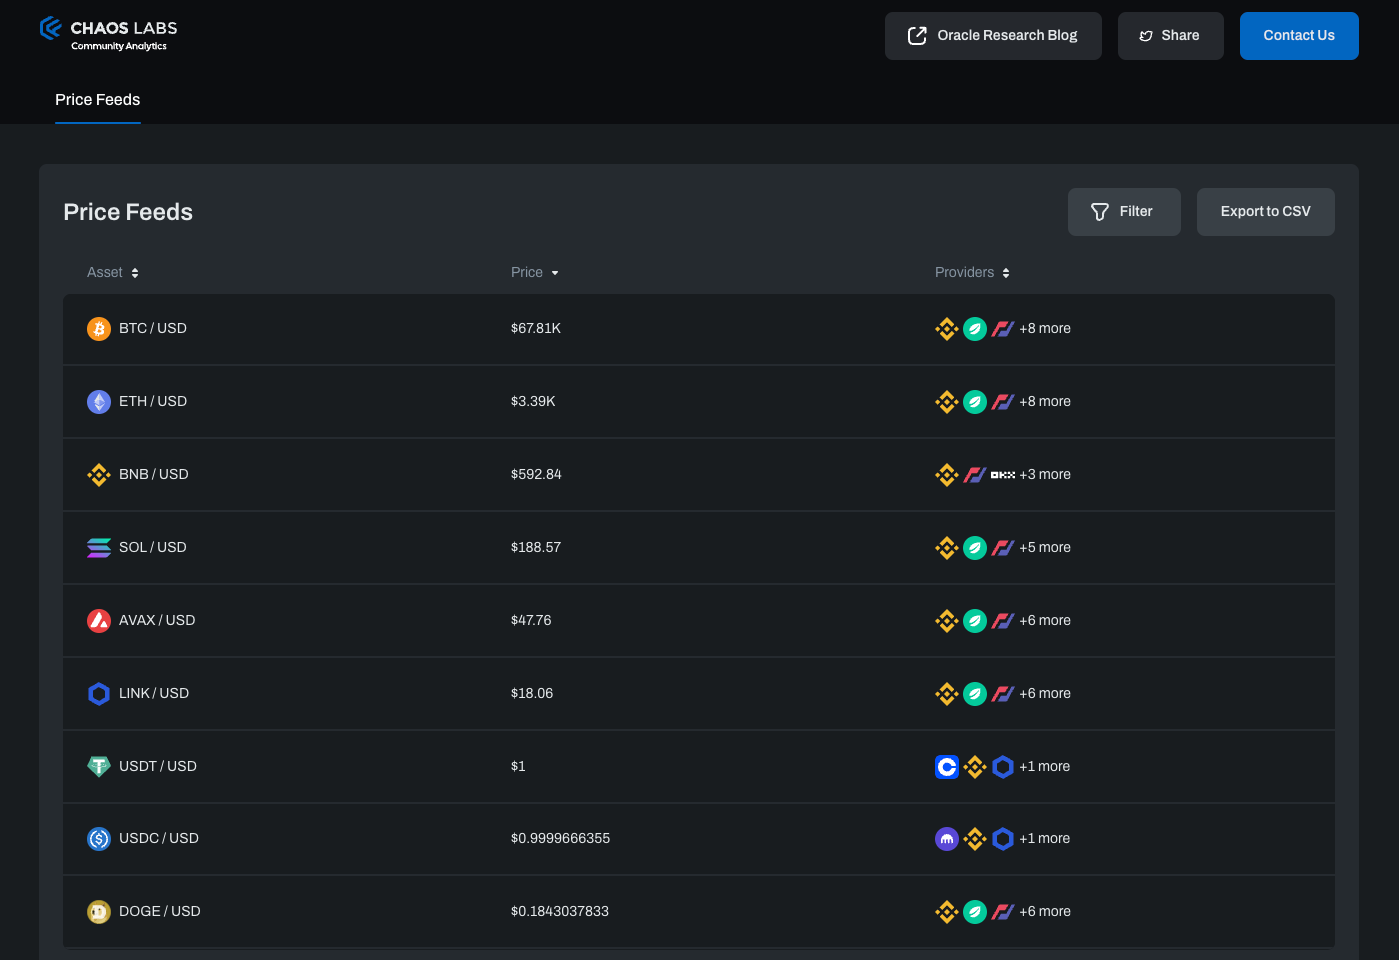
Selecting an asset pair from the list will navigate you to a more detailed page showcasing the analysis of the specific asset.
Asset Price Feed Detail Page
This page offers an in-depth view of statistical data related to the price feed of a selected asset pair. The data is presented in various analytical formats including tables and charts that compare data from multiple oracles and exchanges.

The benchmark oracle is a reference point against which other data providers are compared.
The Providers multi-selection dropdown allows users to choose which data providers (oracles and exchanges) they want to include in the analysis.
The price card tracks the asset's current value in USD and the price trend at various time intervals.
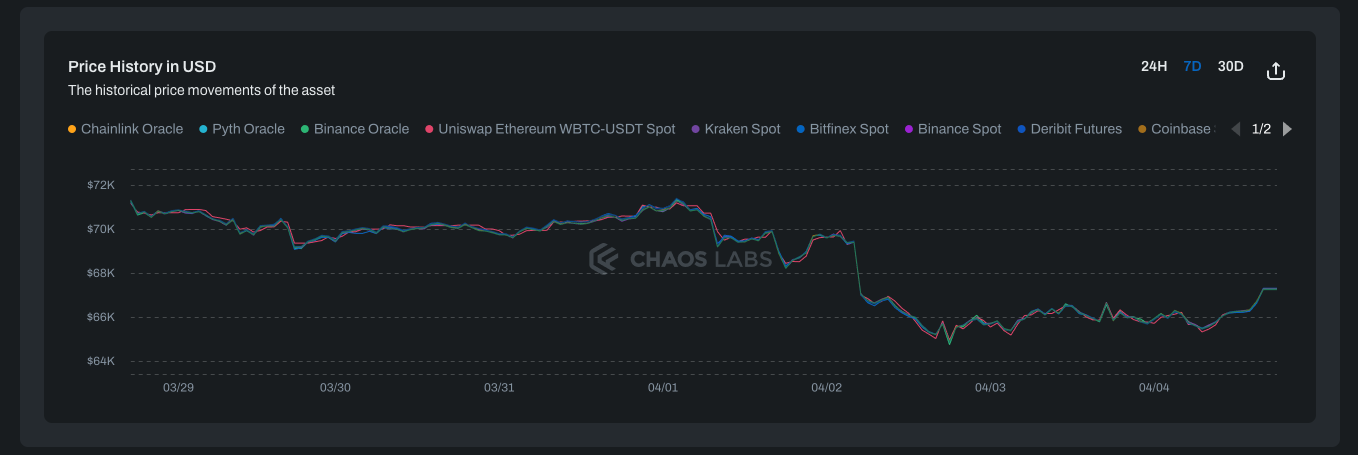
The Price History graph illustrates the fluctuating prices of the selected asset, showing a comparative analysis across various providers over a specified period.
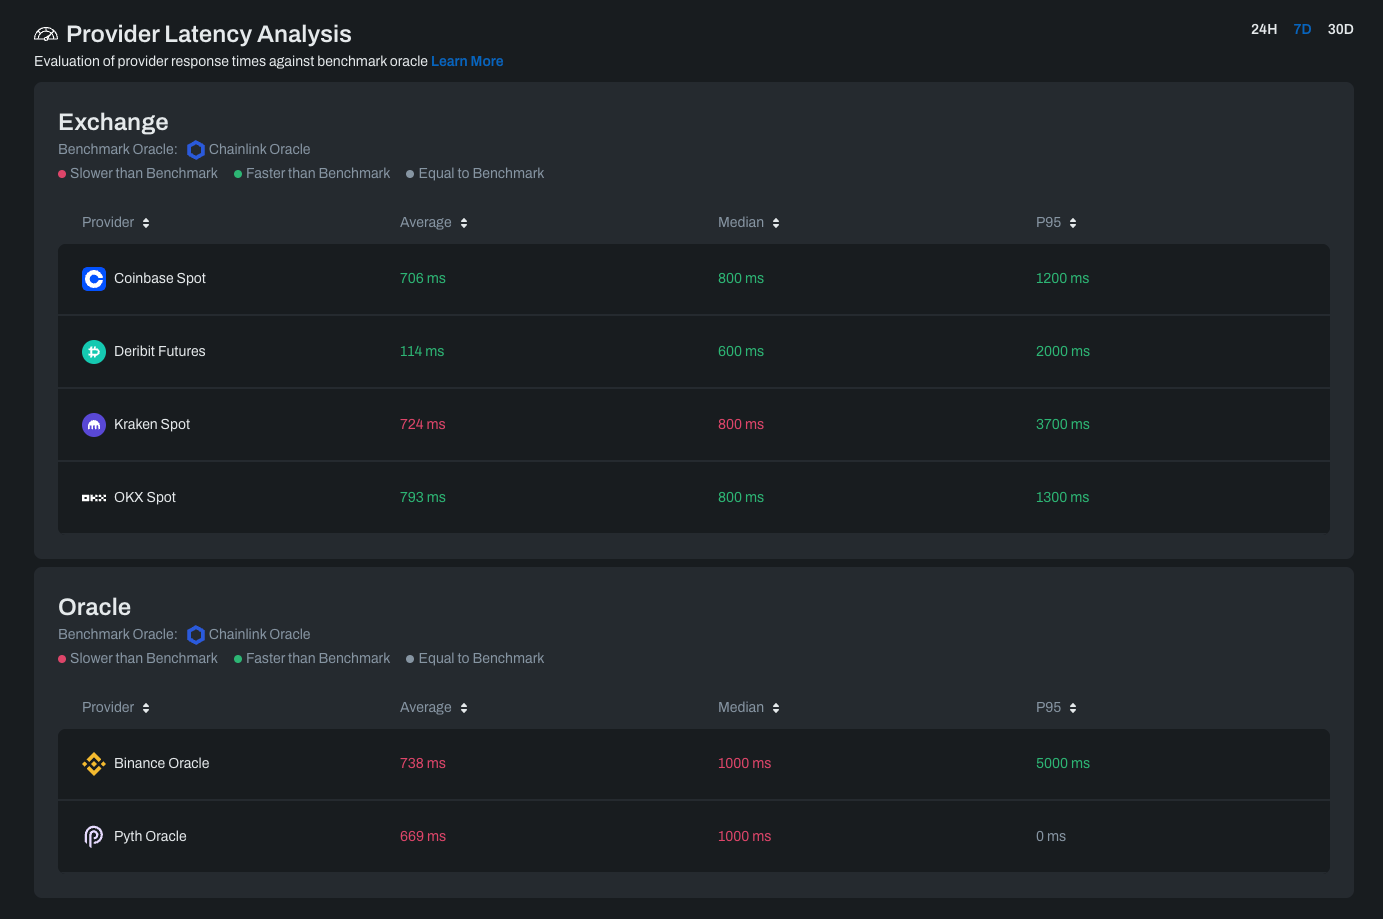
The Provider Latency Analysis tables display the response times of exchanges and oracles, measured in milliseconds, against a benchmark oracle. A red value denotes that the provider's response time is slower than the benchmark oracle. Conversely, a green value highlights that the provider’s response time is faster than that of the benchmark oracle. When a value appears in gray, the response times of the benchmark oracle and the compared provider are the same. For a detailed understanding of the approach used to calculate the latency statistics, please click the "Learn More" button, which will prompt a popup containing the necessary explanation.
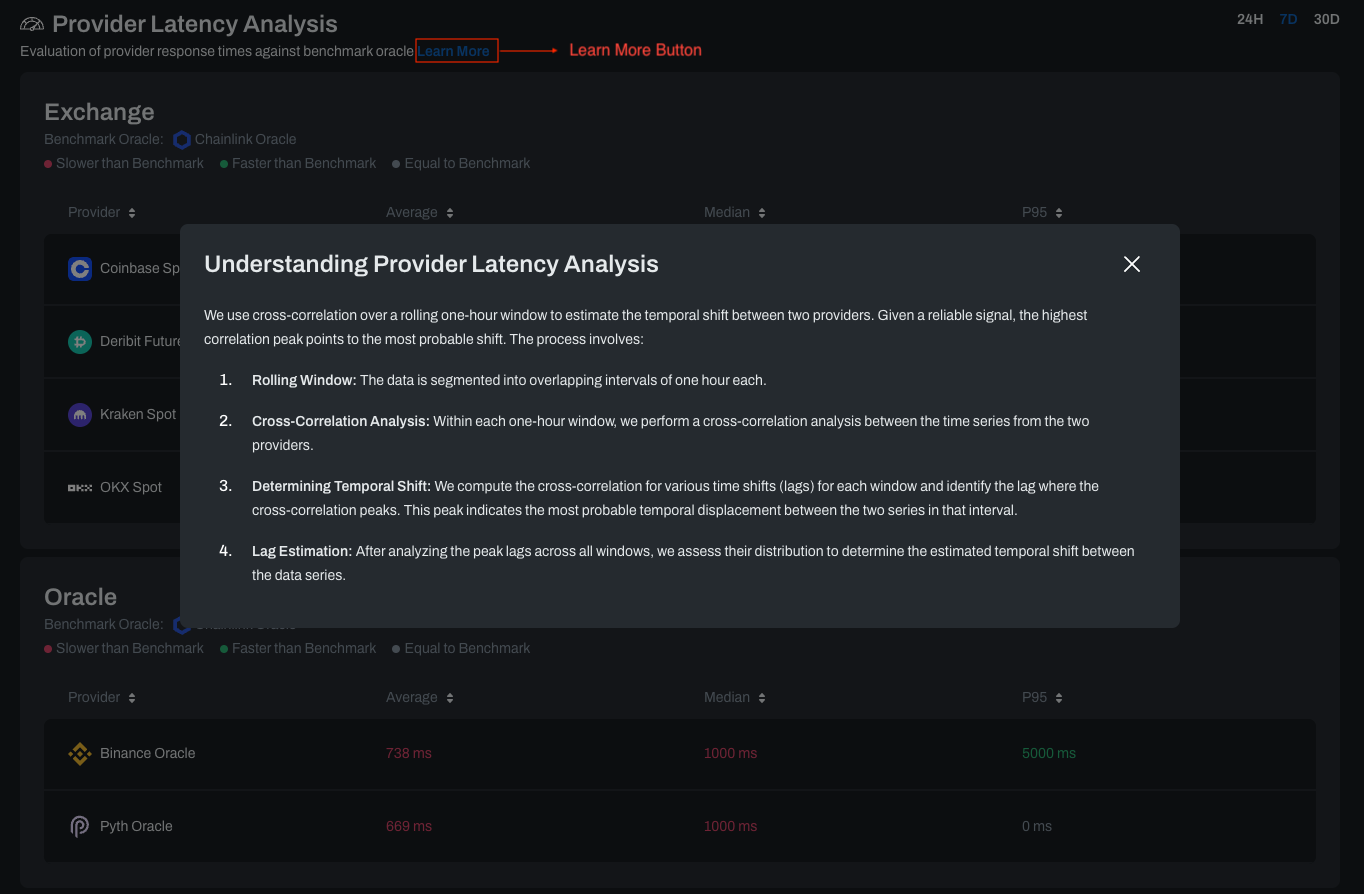
Latency Analysis Computation Methodology
We use cross-correlation over a rolling one-hour window to estimate the temporal shift between two providers. Given a reliable signal, the highest correlation peak points to the most probable shift. The process involves:
- Rolling Window: The data is segmented into overlapping intervals of one hour each.
- Cross-Correlation Analysis: Within each one-hour window, we perform a cross-correlation analysis between the time series from the two providers.
- Determining Temporal Shift: We compute the cross-correlation for various time shifts (lags) for each window and identify the lag where the cross-correlation peaks. This peak indicates the most probable temporal displacement between the two series in that interval.
- Lag Estimation: After analyzing the peak lags across all windows, we assess their distribution to determine the estimated temporal shift between the data series.
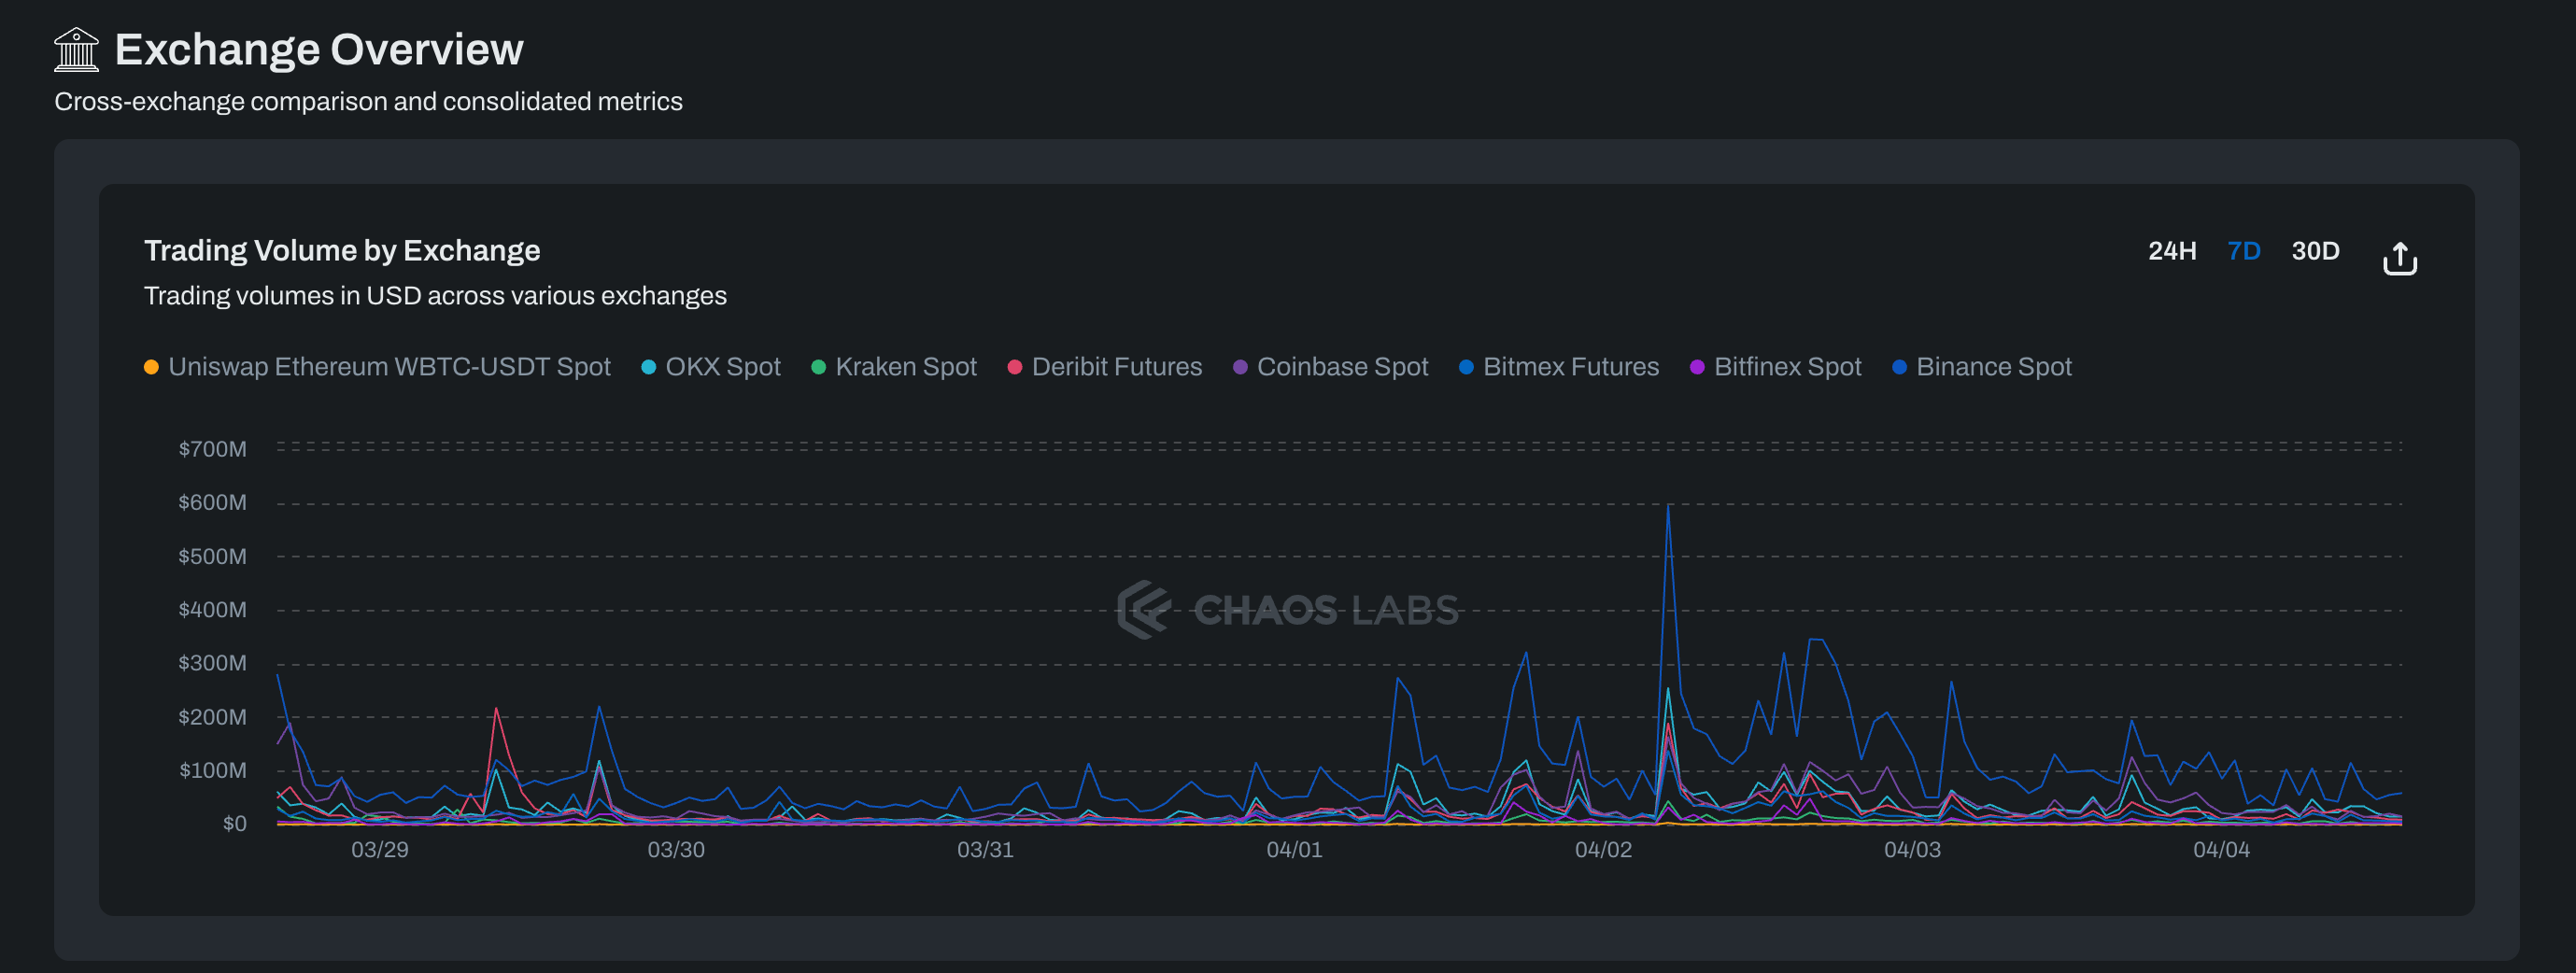
The Trading Volume chart illustrates trading volumes for the chosen asset from selected exchanges, with data spanning a user-defined time frame. This allows for customized tracking of asset liquidity across different exchanges within the selected period.
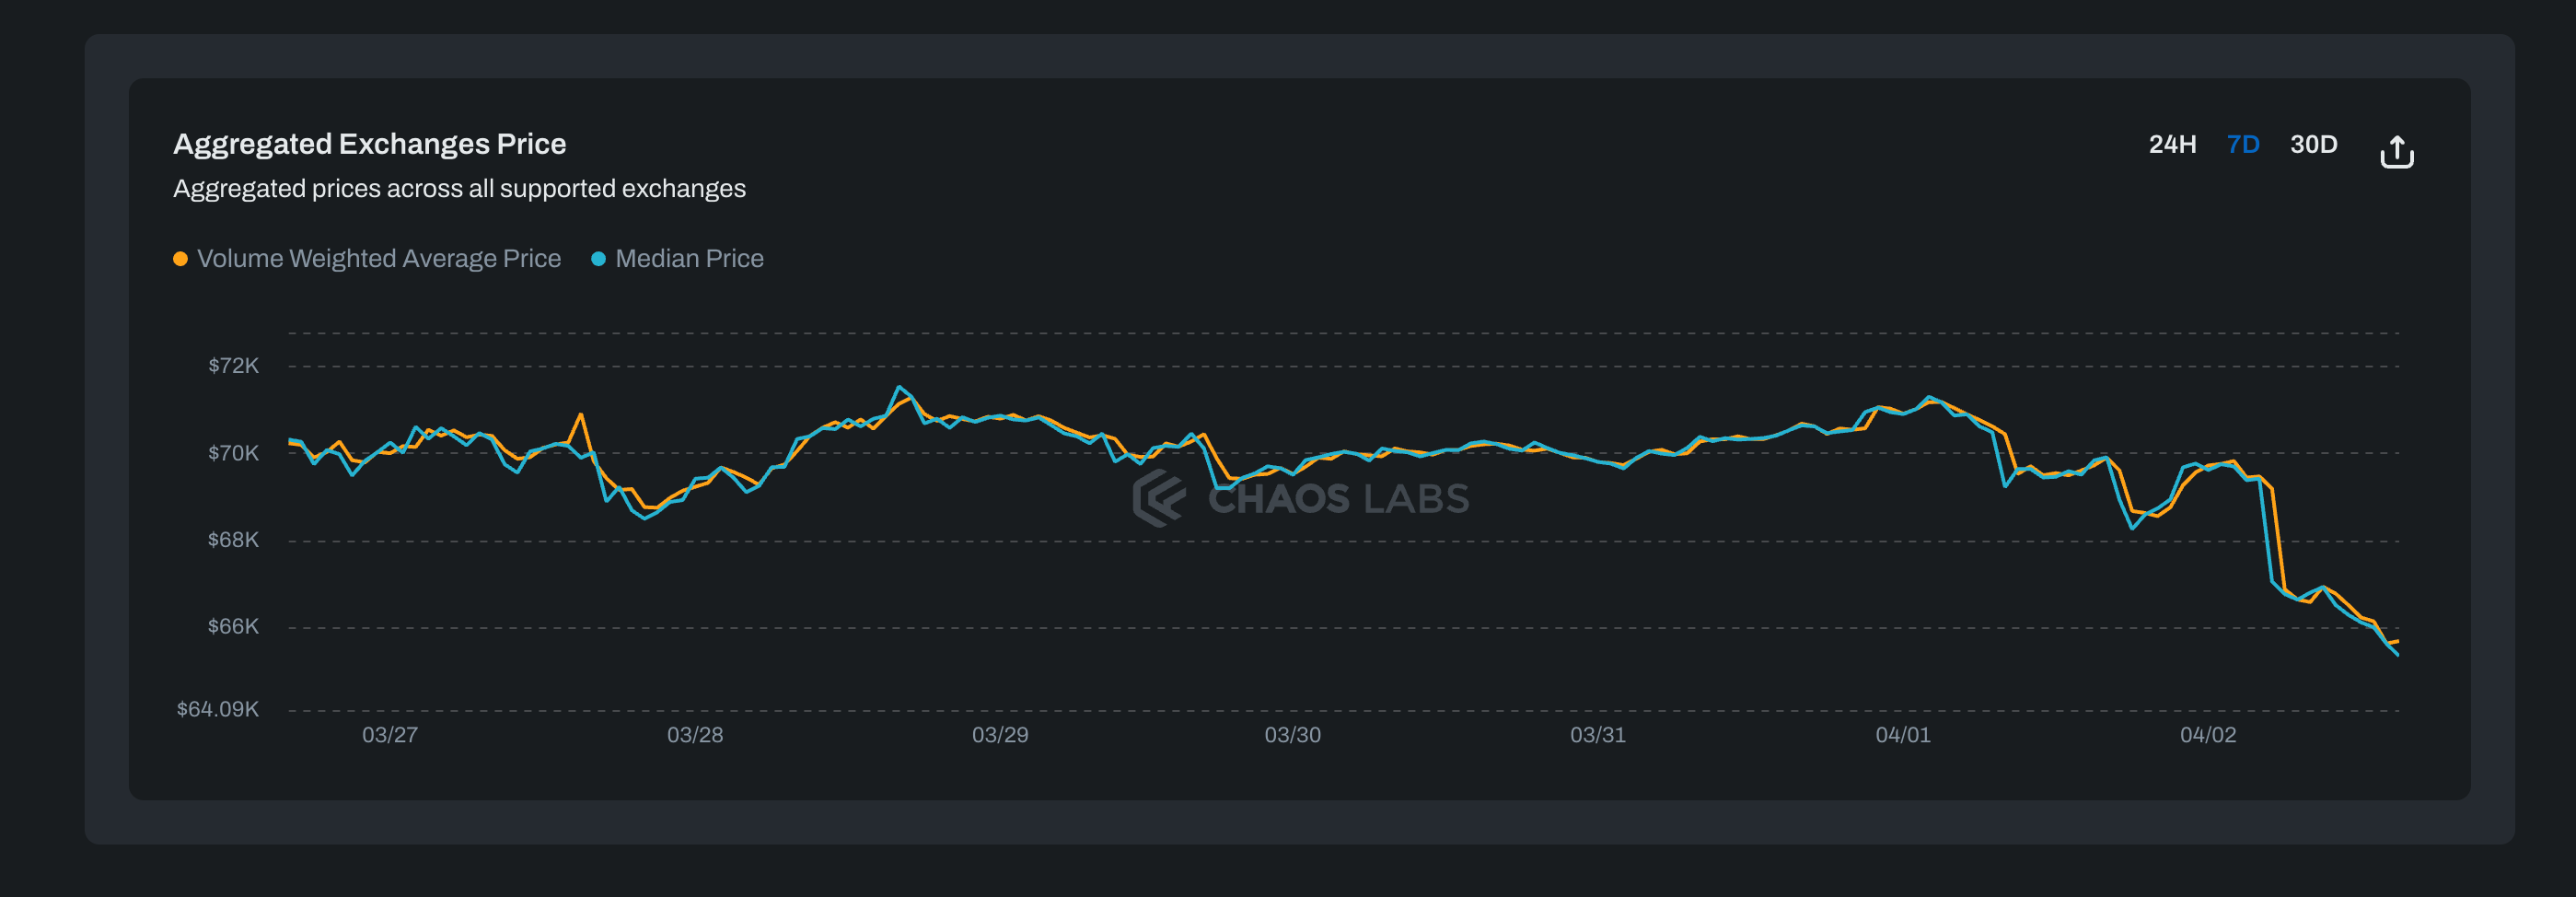
The Aggregated Exchanges Price chart aggregates data from exchanges and displays comparative metrics. It features the Volume Weighted Average Price alongside the Median Price. The Volume Weighted Average Price (VWAP) is determined by multiplying the price of an asset by its volume on each exchange at a specific time, then summing these figures from all exchanges at that time. This combined total is subsequently divided by the overall volume of the asset across these exchanges at the designated time. It’s a consolidated average price that reflects where the majority of volume has traded and emphasizes the importance of prices with higher volumes. The Median Price is the midpoint of all the exchange prices at a specific time.
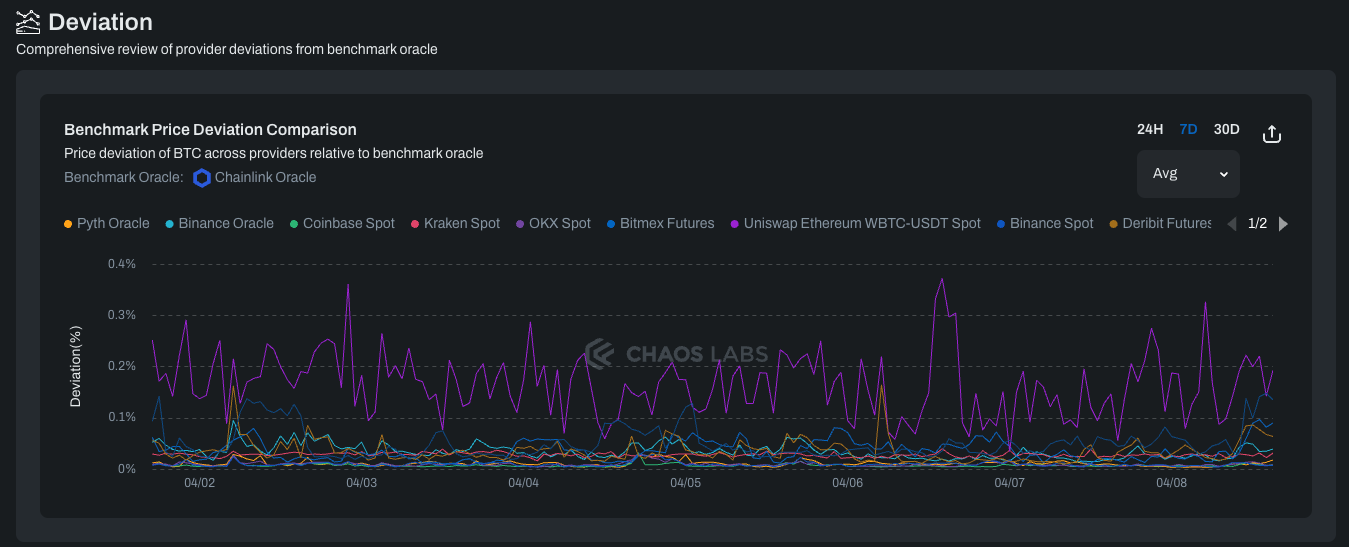
The Benchmark Price Deviation chart displays the deviation in prices for a specific asset from different providers as a percentage difference from the benchmark oracle's price. The user can toggle between viewing the average, maximum, or minimum deviation values.
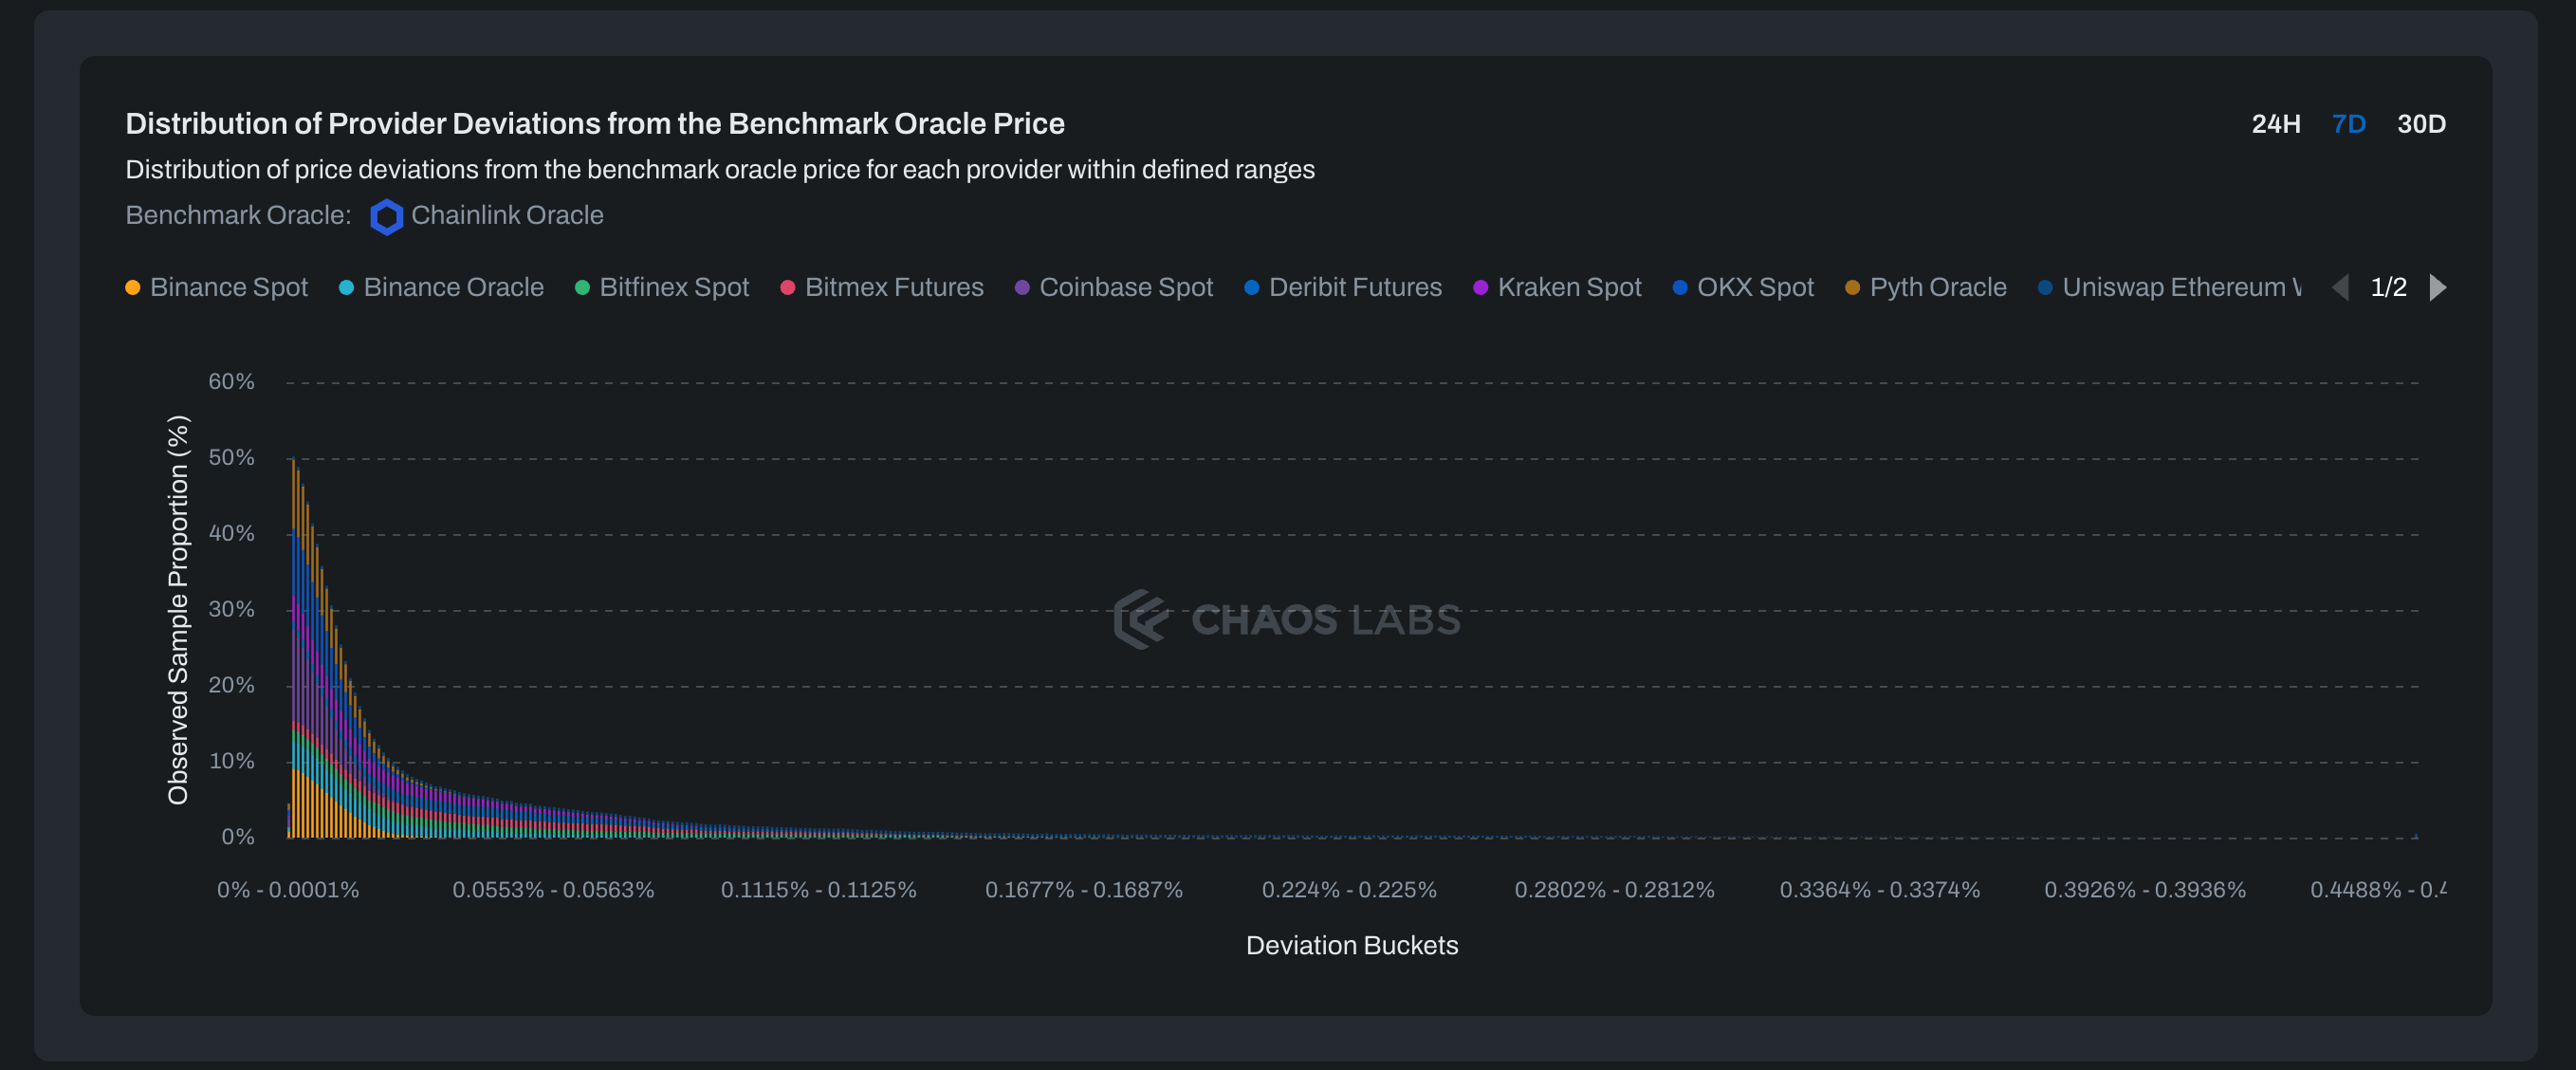
The Distribution of Provider Deviations chart visualizes the distribution of price deviations from the benchmark oracle, categorized into predefined percentage intervals. It demonstrates the frequency with which observed data points align with each interval, providing insight into the distribution pattern of price discrepancies.
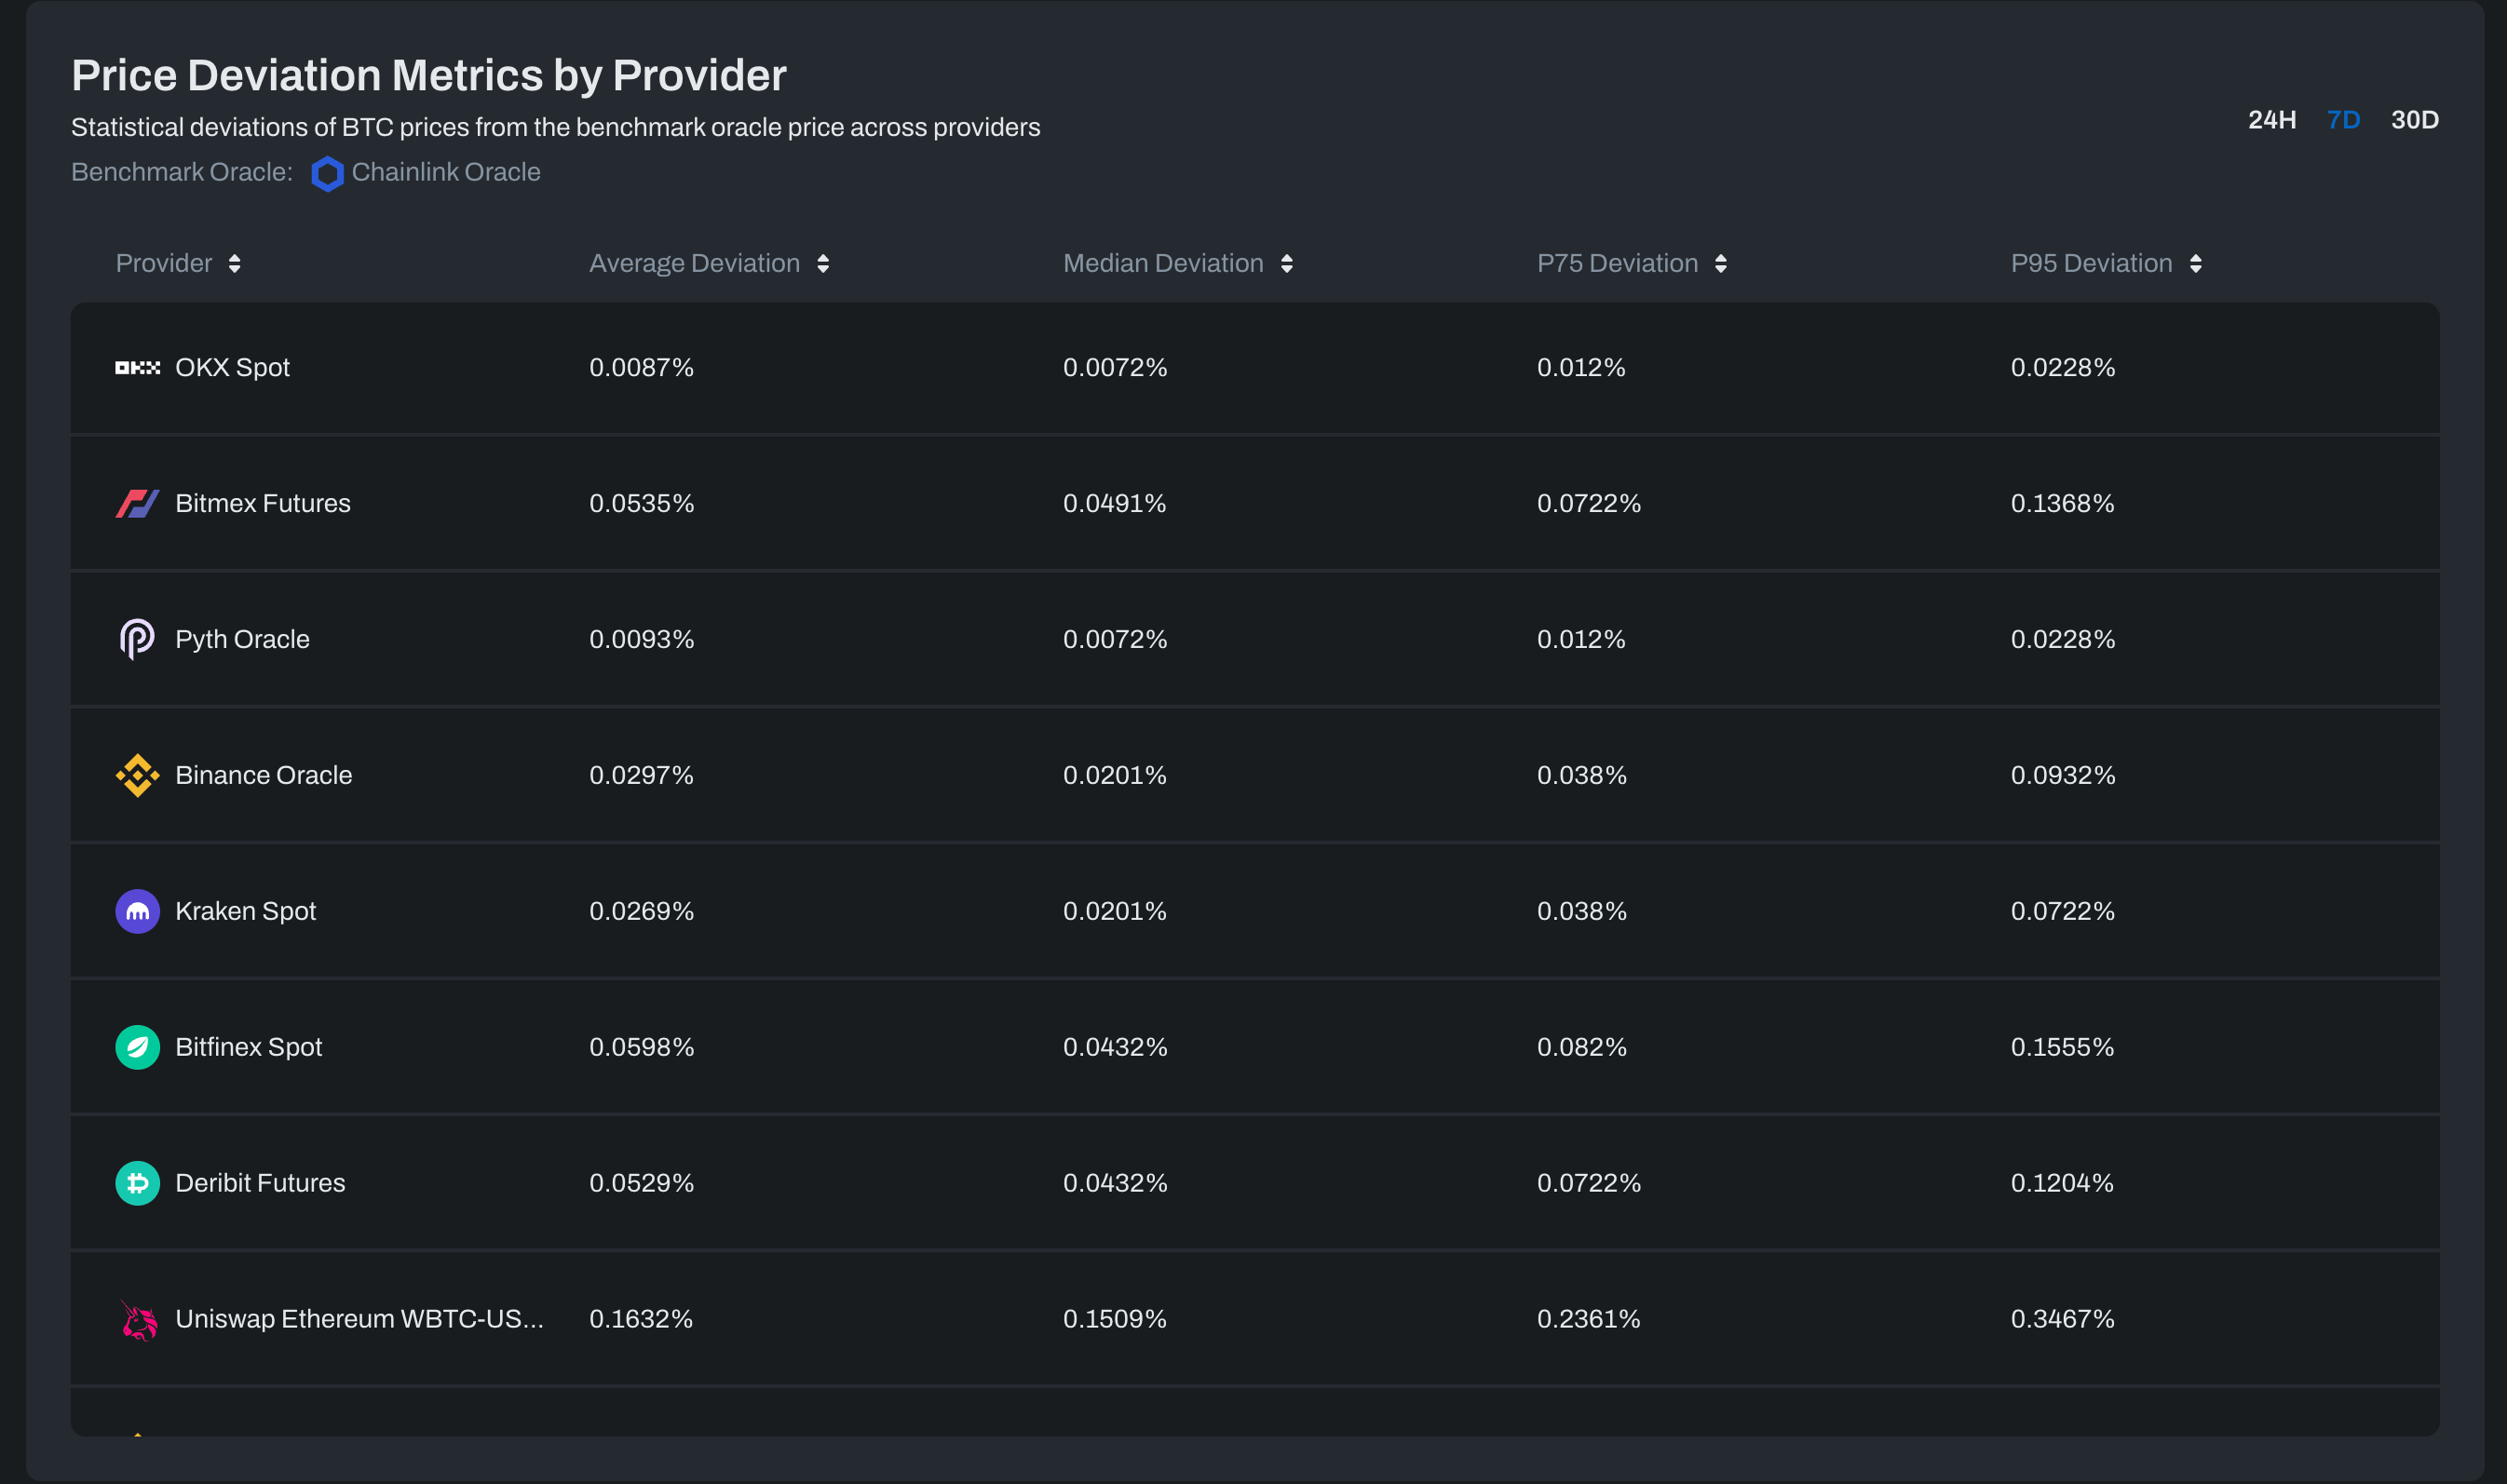
The Price Deviation Metrics table outlines the average, median, P75, and P95 deviation percentages of different oracles and exchanges from the benchmark oracle. The P75 and P95 values are statistical measures where the P75 represents the point below which 75% of the deviations lie, offering a glimpse into the upper-middle range of deviations. Meanwhile, the P95 indicates the threshold below which 95% of the deviations fall, revealing the higher end of deviations and highlighting the outliers.
Granger Causality
The Granger causality statistical test is employed to ascertain whether one time series can predict another, based on the principle that if series A can forecast series B, then A Granger causes B. The primary objective of showcasing this method is to determine if the benchmark oracle outpaces the other oracles and to measure the magnitude of this lead. This approach is crucial for uncovering predictive relationships and timing discrepancies between two series, demonstrating whether historical data from one series can anticipate future values of the other.
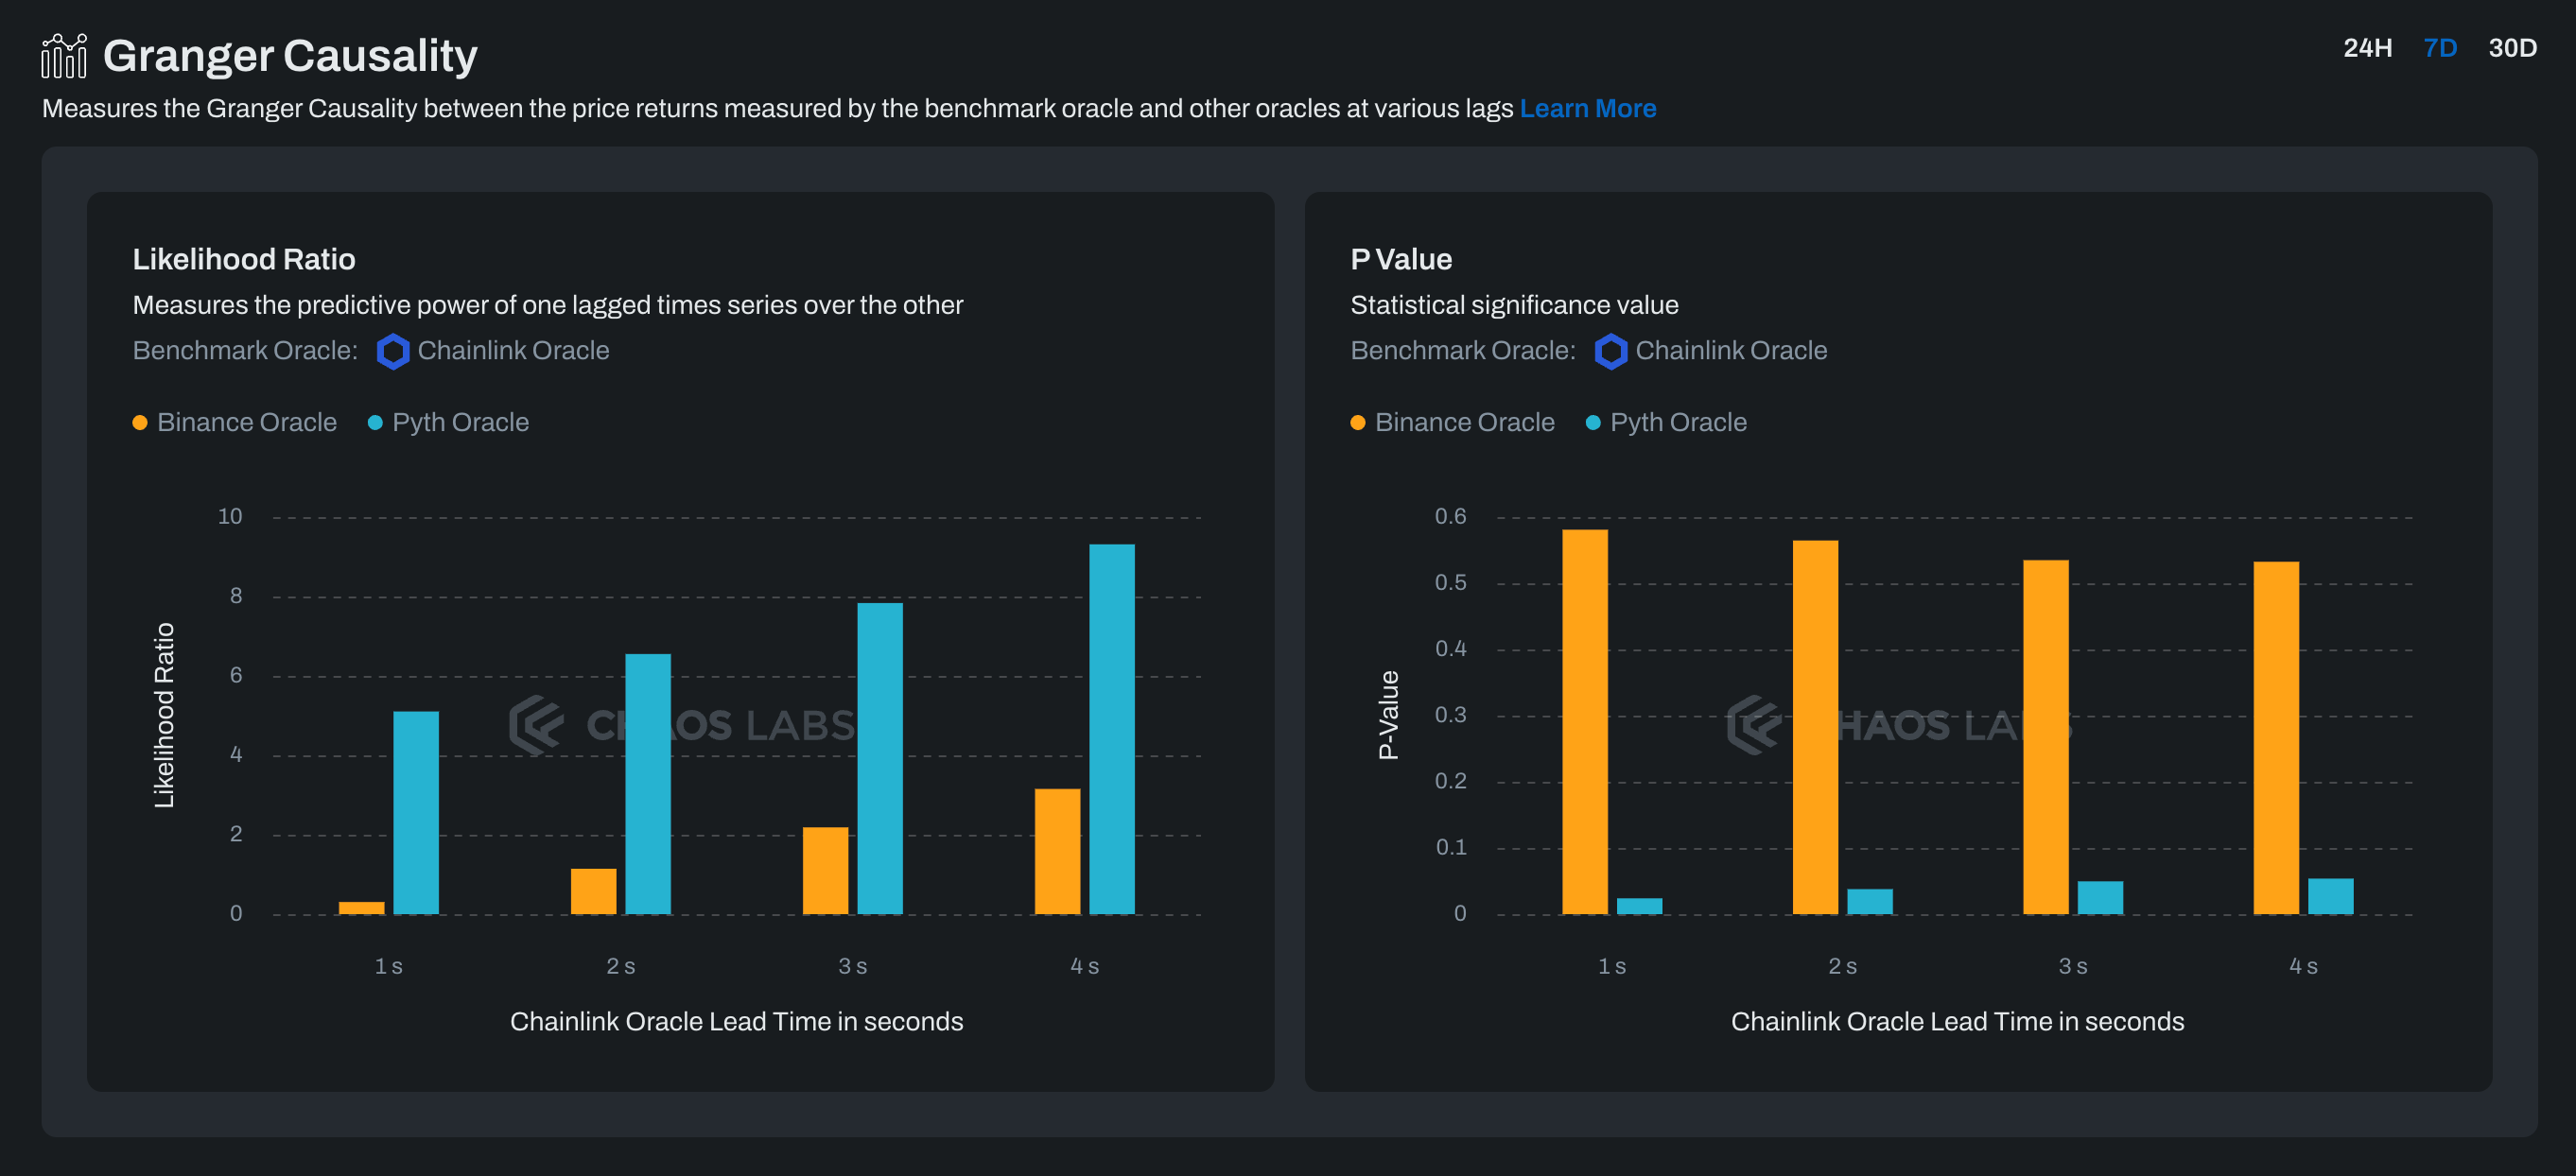
The Likelihood Ratio and the P-value charts display the Granger Causality analysis, comparing the benchmark oracle with other selected oracles. They use the log-likelihood ratio to indicate the strength of causality, and the P-value to assess the statistical significance. The X-axis in both charts represents different time lags, suggesting the lead of the benchmark oracle over the others by a certain margin.
For a detailed understanding of the approach used to calculate the Granger Causality, please click the "Learn More" button, which will prompt a popup containing the necessary explanation.
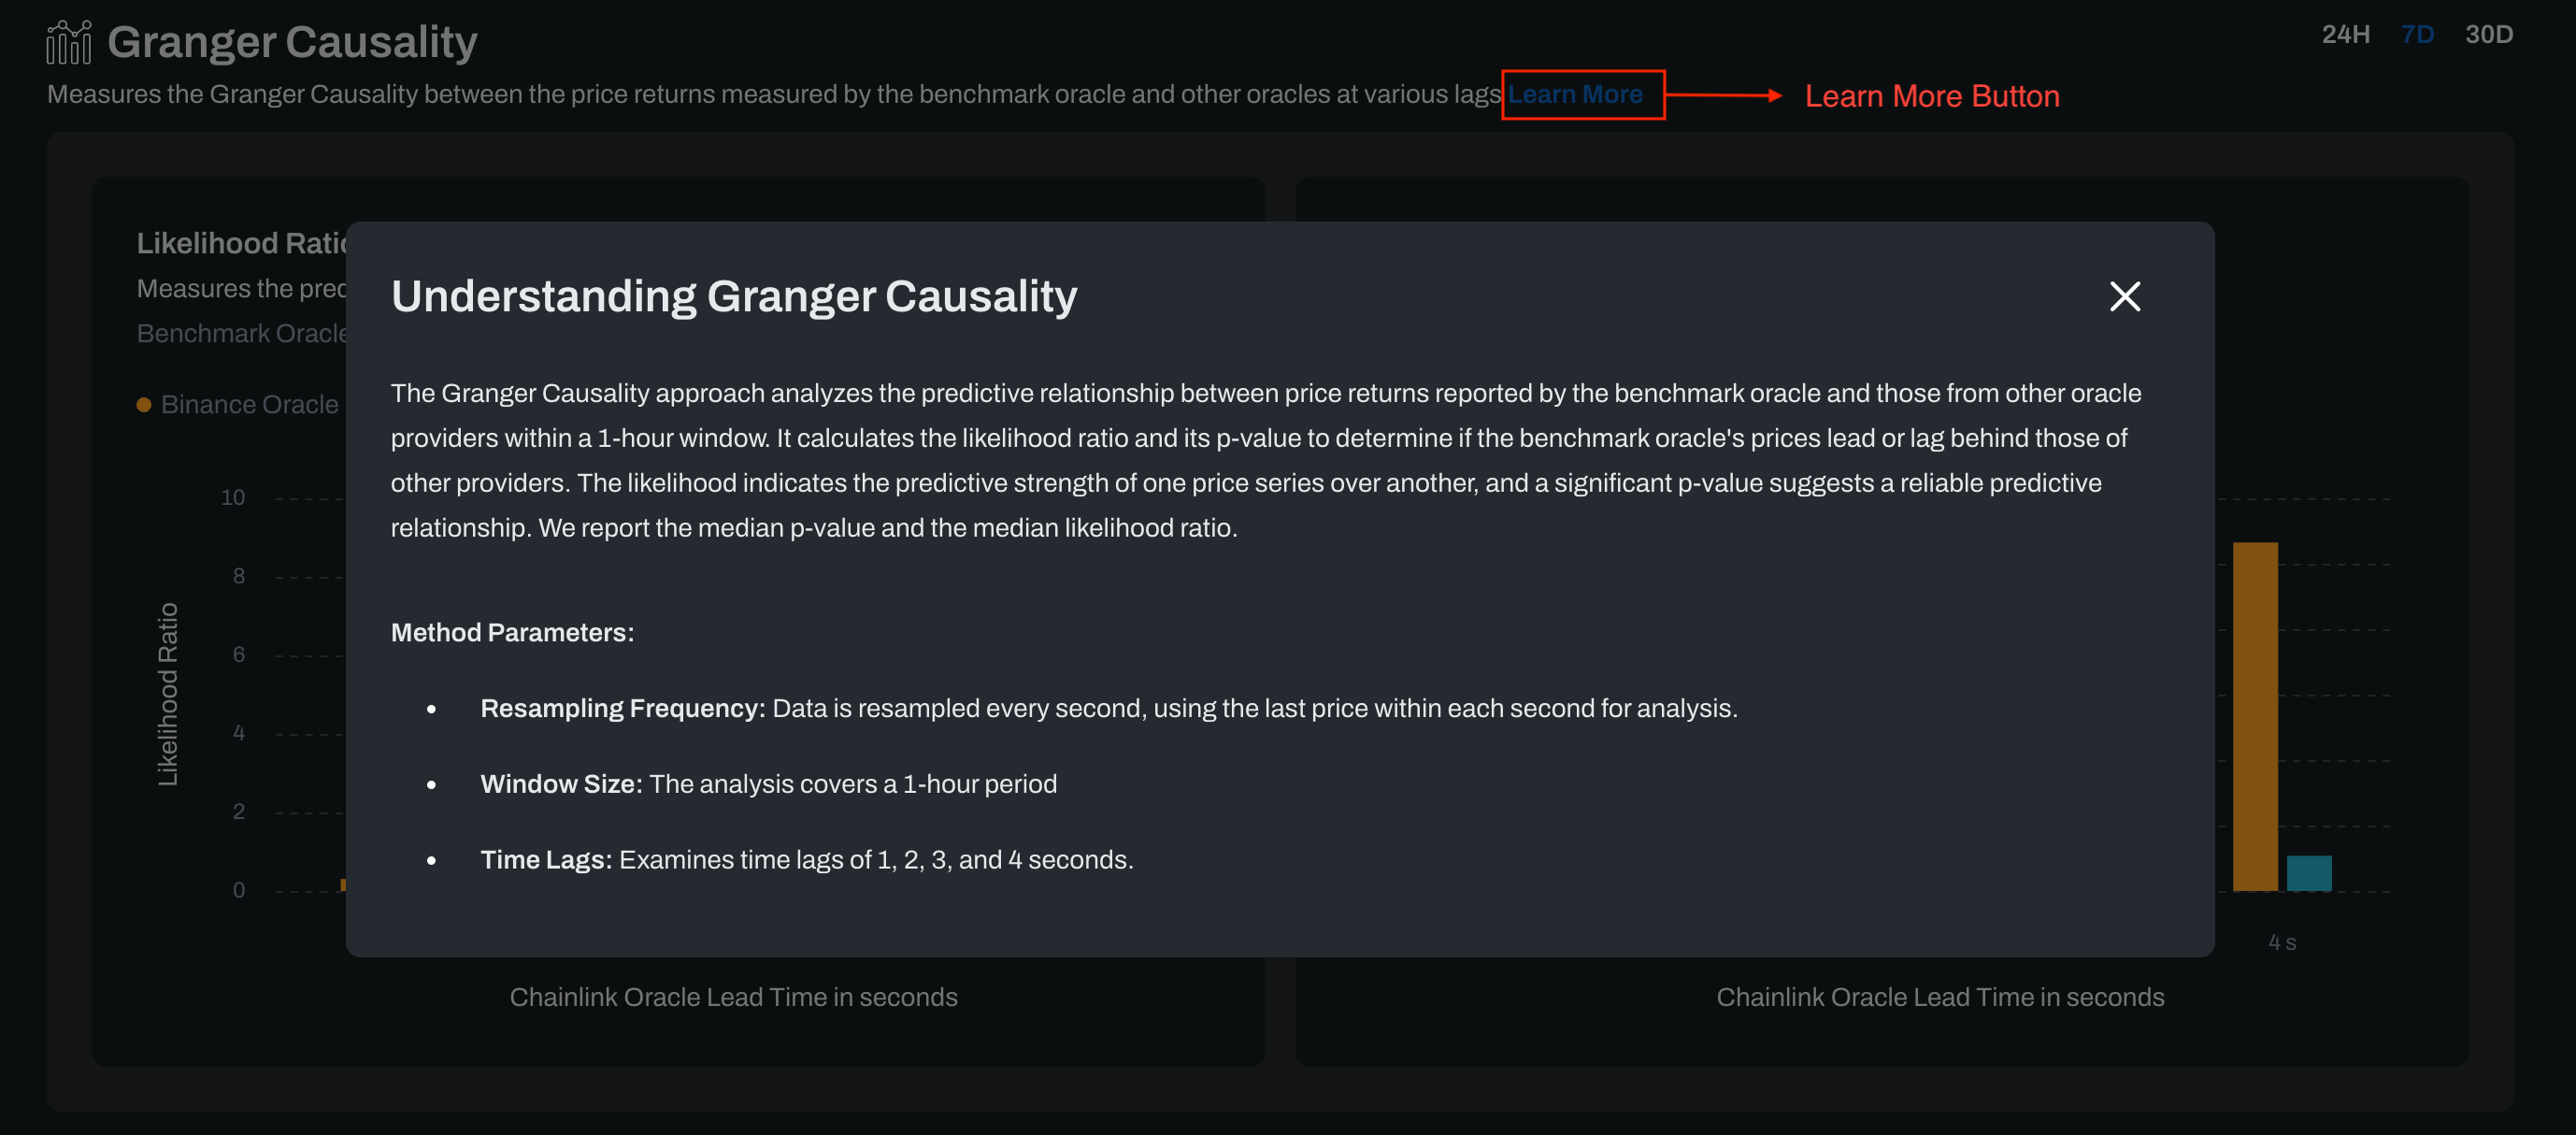
Granger Causality Computation Methodology
The Granger Causality approach analyzes the predictive relationship between prices reported by the benchmark oracle and those from other oracle providers within a one-hour window. By evaluating the likelihood ratio and P-value, we assess whether the benchmark's prices lead or lag, focusing on the median values of these measures for a robust analysis.
Method Parameters:
- Resampling Frequency: Data is resampled every second, using the last price within each second for analysis.
- Window Size: The analysis covers a one-hour period.
- Time Lags: Examined time lags of 1, 2, 3, and 4 seconds.
This streamlined approach underscores the importance of high log-likelihood ratios for strong relationships and low P-values for significant causality evidence.
Community Feedback
We are excited to share this new Oracle Risk Portal with the community and look forward to hearing your thoughts and opinions about it. Please consider using the share button on the portal header to spread the word about this portal. Additionally, we encourage you to explore our Oracle Research Blog, where you can find a collection of our most recent groundbreaking research articles.
Please share your feedback, suggestions, and experiences with the new portal using the Contact Us button on the product header. Your input directly contributes to our ongoing improvement efforts and helps us tailor our products to meet your needs better.
Arbitrum STIP Risk Analysis | Case Study #1: Vertex
As part of our recent election as the Risk Member on the Arbitrum Research & Development Committee (ARDC), Chaos Labs is excited to share a blog post detailing our first case study for the ARDC: Vertex. This is the first case study of a three-part series that entails an in-depth analysis of the risk and efficiency of the Arbitrum STIP on three major protocols, the first of which is Vertex. As requested by the DAO advocate for the ARDC, L2BEAT, Chaos Labs has begun conducting case studies on STIP recipients. This case study provides an in-depth analysis of the Arbitrum STIP program’s impact on the Vertex Protocol, focusing on its efficiency and associated risks. This analysis is part of a broader series that evaluates the STIP program across three major protocols. We will begin by introducing the STIP program and giving an overview of Vertex, followed by our team's full case study.
Oracle Risk and Security Standards: Price Composition Methodologies (Pt. 3)
This chapter delves into the intricate world of Price Composition Methodologies, a foundational pillar of Oracle risk and security. It encompasses an in-depth analysis of data source selection and validation, an exploration of the limitations of rudimentary pricing methods and opportunities for improvement, concluding with an examination of the tradeoffs between price aggregation techniques grounded in real-world examples. This holistic overview guides readers through the practices and innovations that exemplify the relationship between price composition and Oracle security.
Risk Less.
Know More.
Get priority access to the most powerful financial intelligence tool on the market.