The Imbalance Score: A Novel Metric for Ostium's RWA-Focused Perpetual DEXes
Table of Contents
Abstract
Real World Assets (RWAs) tokenization is significantly transforming the landscape of decentralized finance (DeFi). By digitizing traditionally illiquid assets such as property, commodities, and financial instruments into digital tokens, this innovation unlocks liquidity in markets that were previously less accessible. This article delves into integrating RWA markets within Perpetual Decentralized Exchanges (DEXes), particularly examining the role of Ostium, an RWA-focused DEX. We focus on exploring the risk mitigation levers for assets with weak correlations, a key feature of Ostium's approach. Before we delve into the technical aspects, it's essential first to understand the broader promise and potential impact of RWAs in DeFi.
Diverse Tokenization Applications
Chaos Labs has previously done a deep dive on RWA Potential in the RWA Report. We briefly cover the use cases below before focusing on the RWA from a risk perspective.
Tokenized Debt
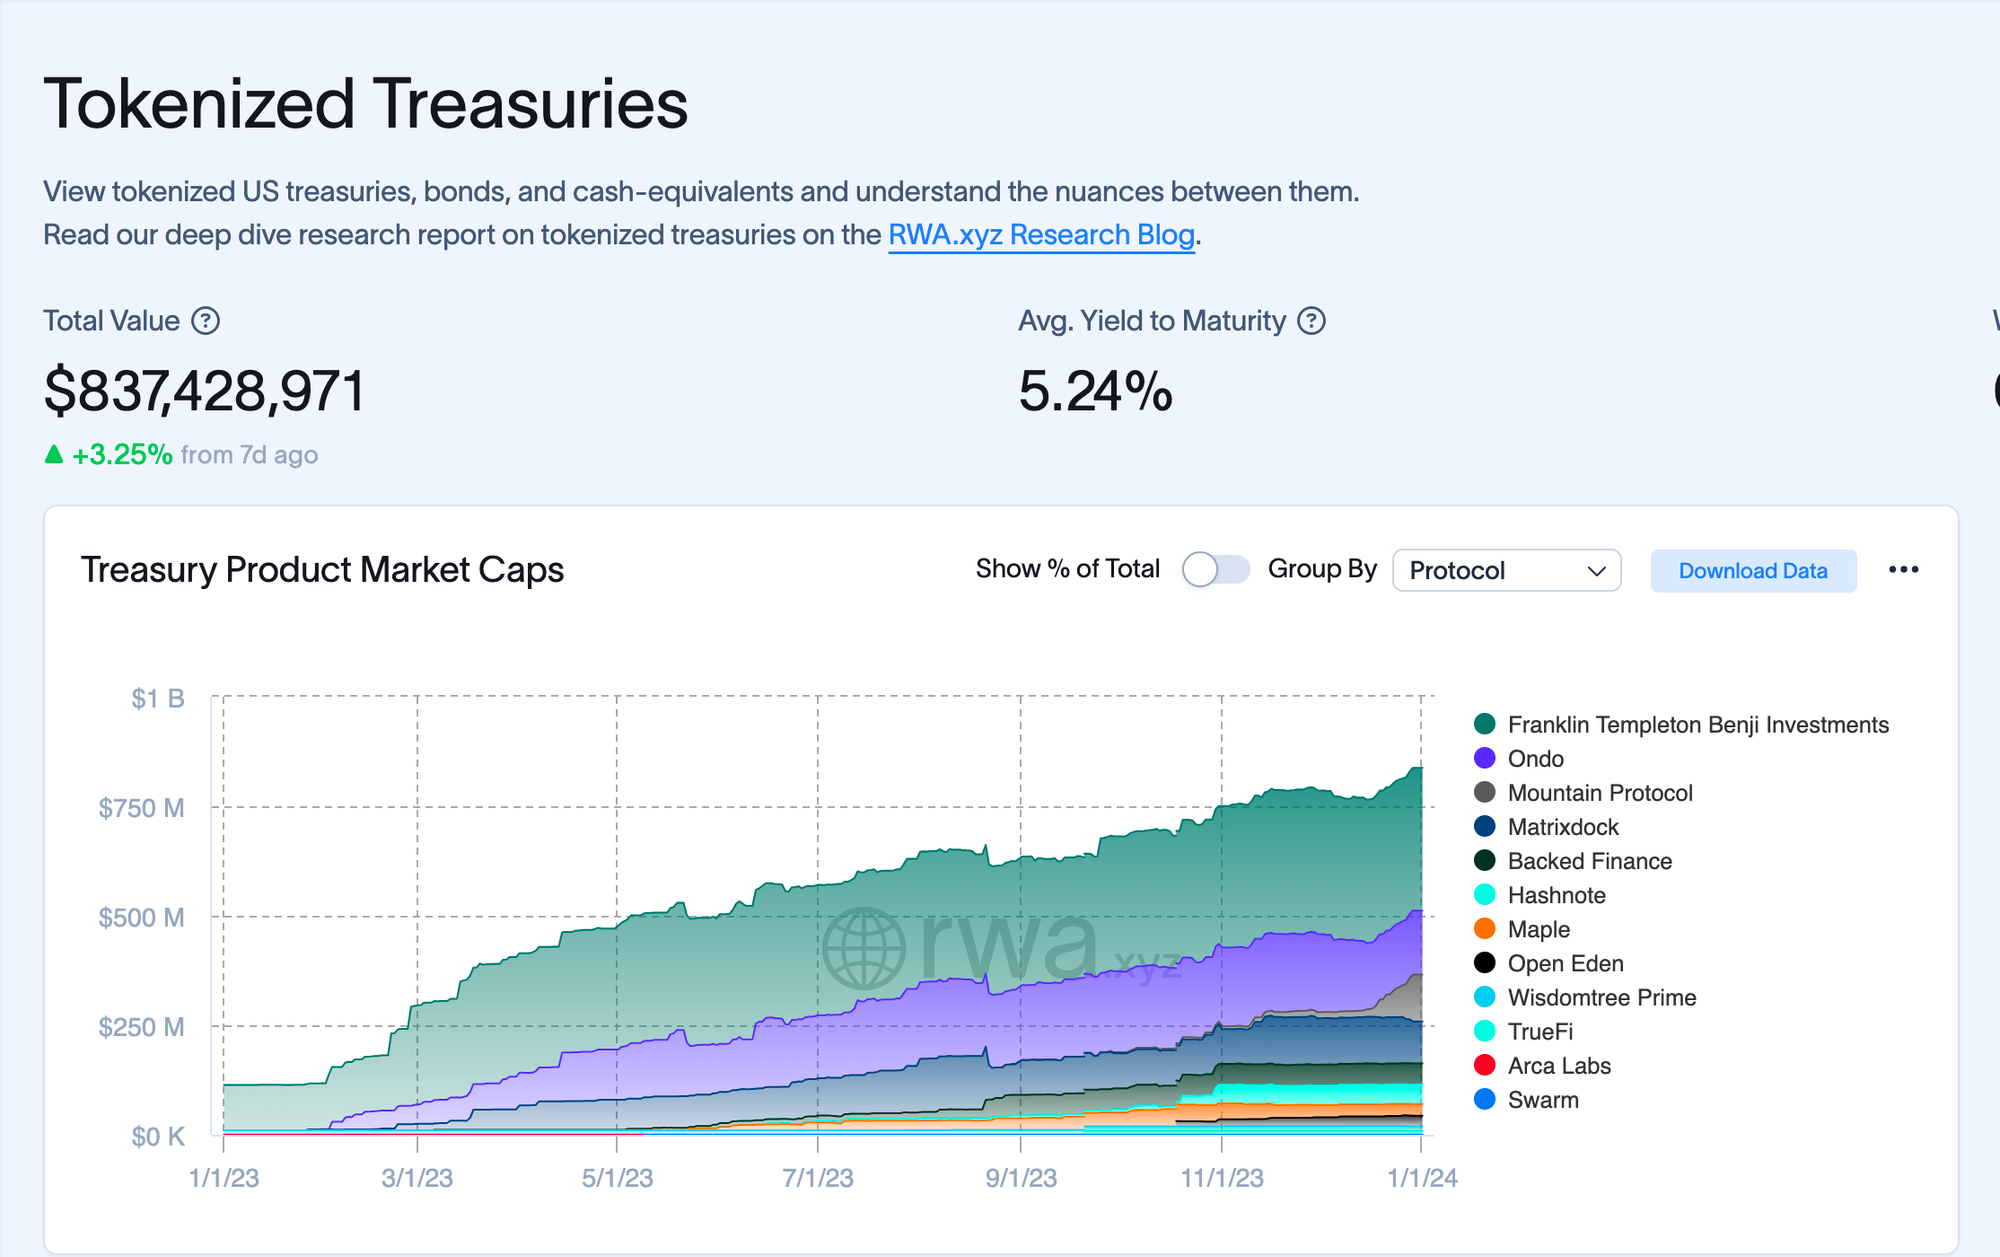
Various RWA protocols, like Ondo Finance and USDV, offer access to significant TradFi markets, such as US Treasury Bills and corporate bonds. Projects like TrueFi bring debt infrastructure on-chain, tokenizing assets like US Treasury Bills and creating opportunities for collaboration between DeFi and TradFi.
Tokenized Equity
Efforts to bring equities on-chain, such as the Mirror protocol and Binance's token tracking Tesla's stock price, have seen mixed results due to regulatory challenges. Aktionariat in Switzerland offers a platform for legal security tokens, indicating potential growth in this sector.
RWA Lending
Platforms like Centrifuge, Maple Finance, and Goldfinch highlight the evolution of lending in DeFi, connecting borrowers and investors through tokenized financial assets and NFTs and showcasing diverse yield options and global debt opportunities.
Physical RWAs
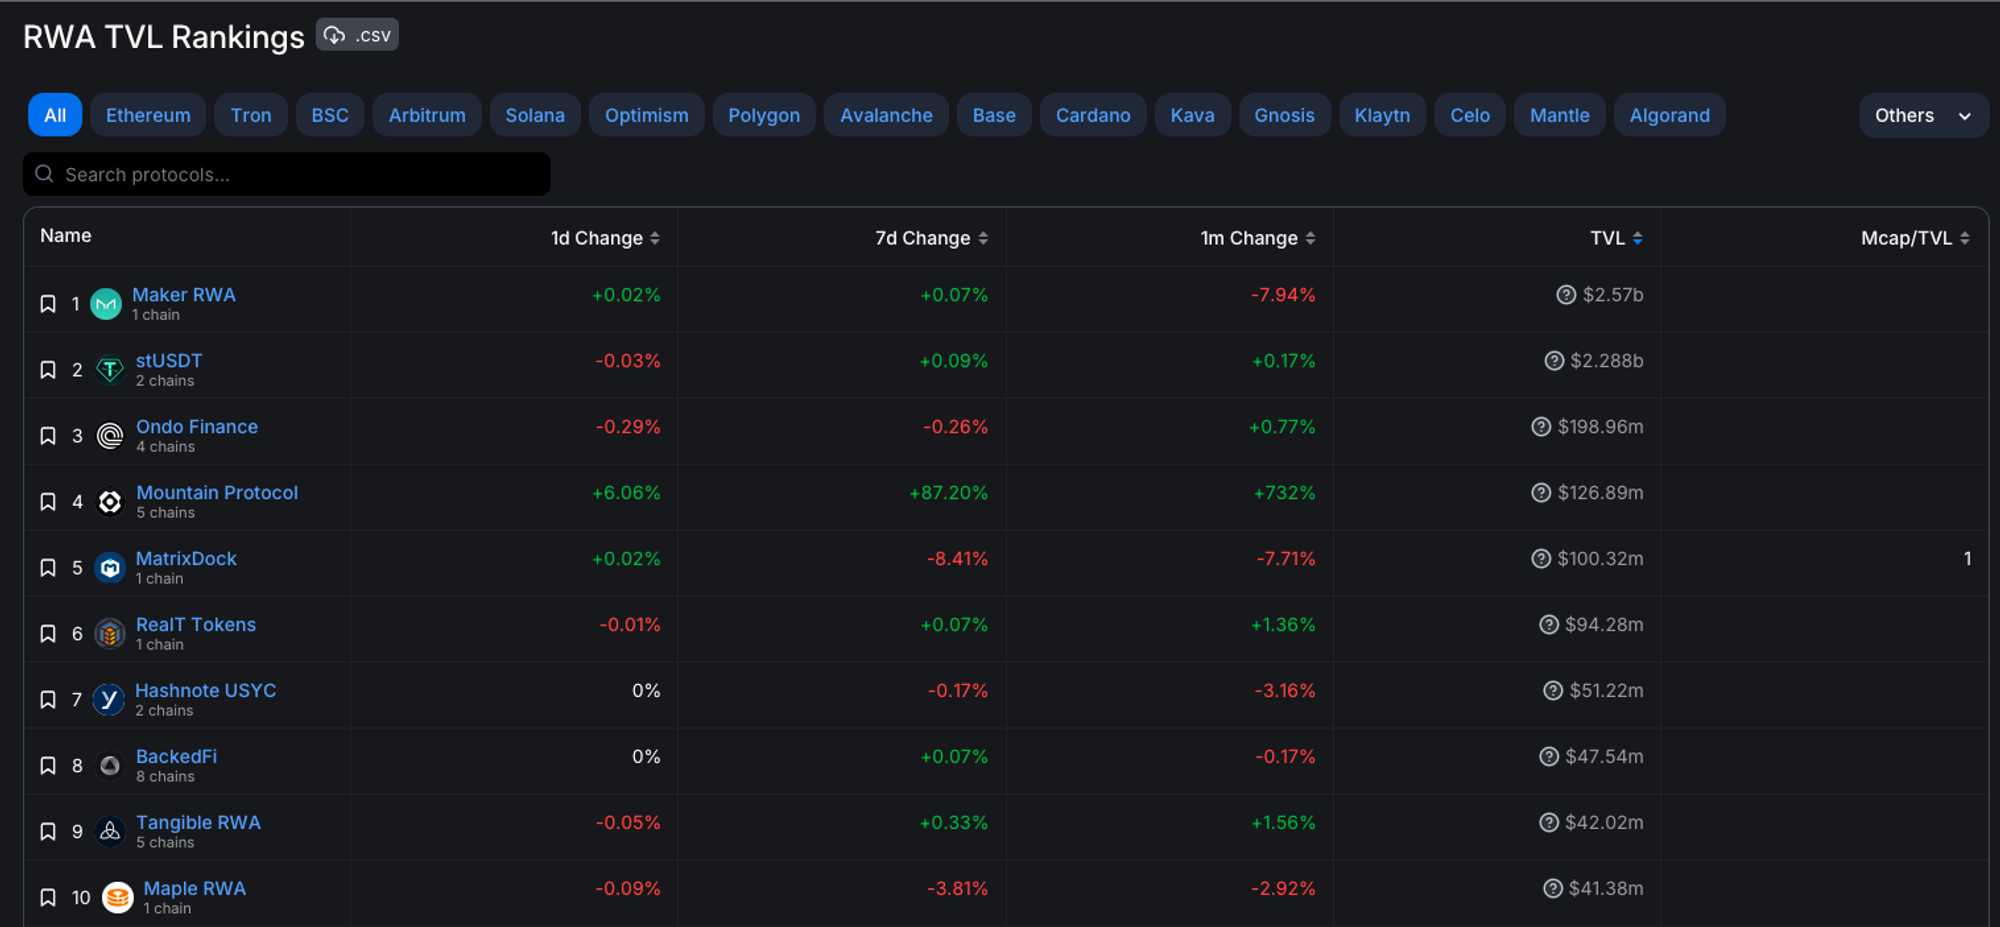
Tokenization extends to real estate and commodities, with platforms like RealT enabling fractional ownership in real estate and projects like Paxos and Tether pioneering digital gold. This democratizes investment and adds efficiency and transparency to these markets.
This article delves into the transformative impact of RWAs in DeFi, highlighting diverse applications and their potential to reshape the landscape of decentralized finance.
RWA is Still Nascent
While there is growing interest in stablecoins and on-chain tokenized bonds, significant trading volumes in RWA markets, particularly in derivative markets that dominate on-chain trading, remain elusive.
This is where Ostium, a protocol dedicated to RWAs, steps in. Ostium is at the forefront of unlocking the deepest liquidity pools worldwide and integrating them into the DeFi ecosystem. The potential benefits of on-chain RWA exposure are immense, not just in terms of liquidity but also in risk mitigation.
This article approaches the RWA opportunity from a portfolio diversification and risk perspective. Utilizing Modern Portfolio Theory, we explore how the typically weaker correlations between cryptocurrency and RWA asset classes introduce asset diversification. We can significantly reduce portfolio risk by integrating these less correlated RWAs into multi-asset single-pool trading DEXes. We present basic simulations to quantify this impact, offering a glimpse into a new era of trading where traditional finance principles are seamlessly integrated with innovative blockchain technologies.
We recommend the Ostium paper for readers interested in a more in-depth analysis of Ostium's unique approach and specific contributions to risk quantification in the context of RWAs.
Risk Management with Asset Correlation Focus
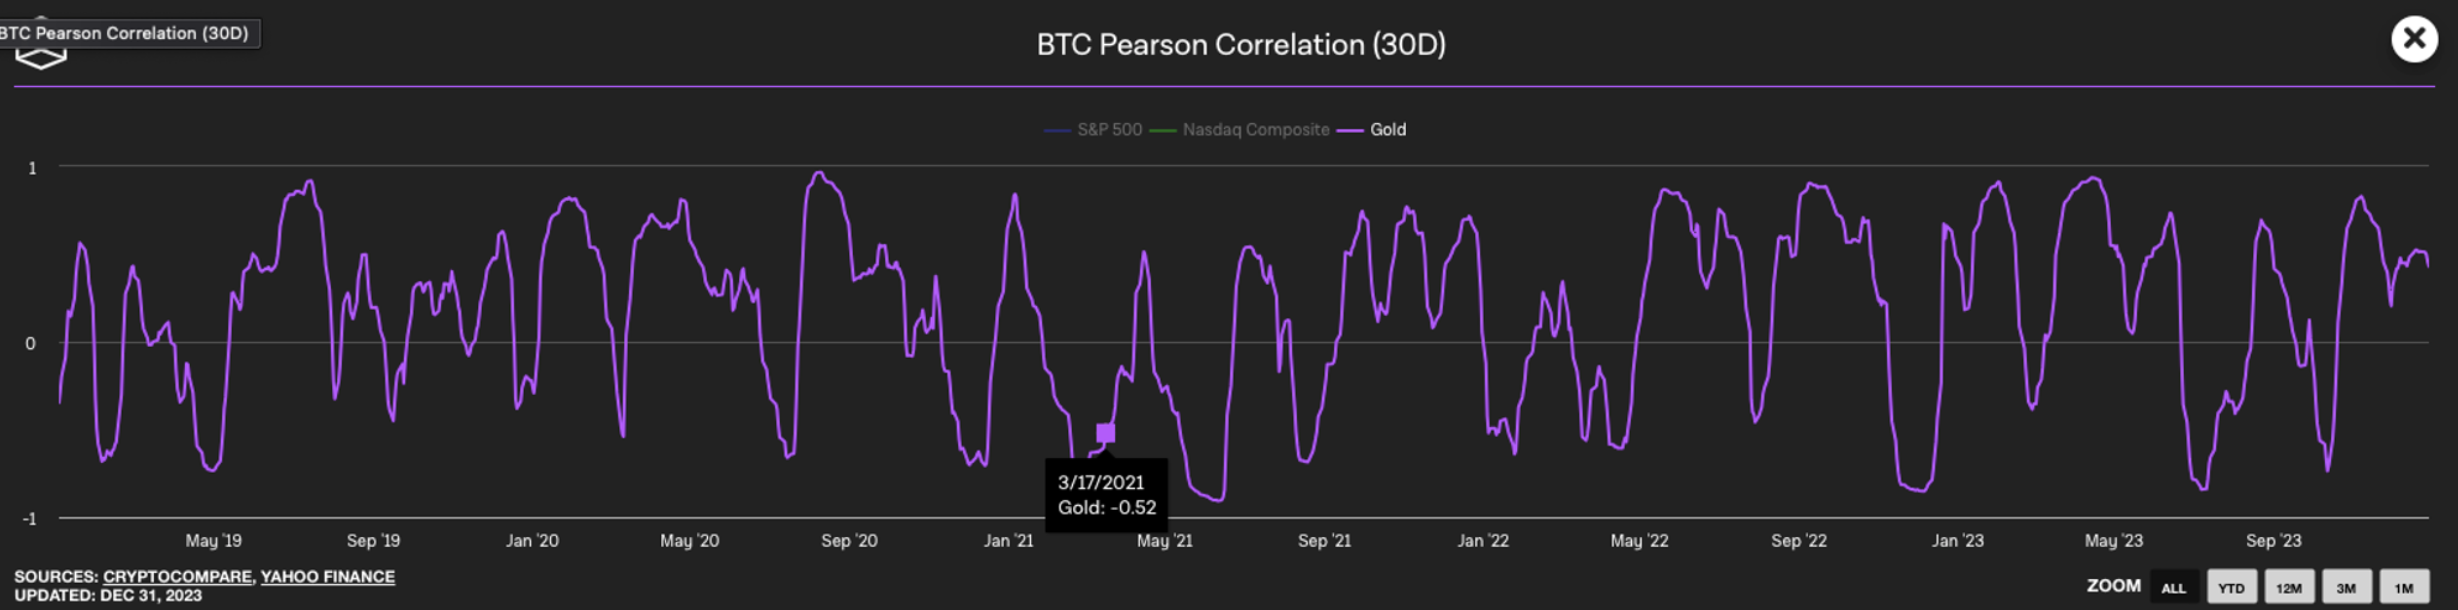
In multi-asset pool-based perpetual Automated Market Makers (AMMs), a significant challenge arises from the high correlation observed within crypto asset portfolios. Historically, assets like Bitcoin (BTC) and Ethereum (ETH), which drive substantial market volume, have exhibited inter-asset solid correlations. Although these correlations have somewhat weakened over time, they remain pronounced. This high correlation entails considerable directional risk and typical concentration risk in pools of closely correlated assets.
The issue with highly correlated asset pools is particularly evident during market volatility or dislocations, where they often experience large-scale, simultaneous liquidations or, conversely, significant aggregated gains during market upswings. This phenomenon underscores the inherent risks in such correlated systems.
Single-pool AMMs have implemented strategies to mitigate these risks. One approach is limiting the available Open Interest relative to the pool size, which reduces default risk but at the cost of lower capital efficiency. Additionally, innovative fee structures have been designed to address the externalities of certain positions. A notable example is the implementation of non-linear funding rates, especially when trades are opened on the pool's more popular or skewed side.
While these measures are beneficial, they do not comprehensively address systemic risk. Another pivotal strategy is asset diversification. To understand its impact, we can analyze the correlations between the top five cryptocurrency pairs by market capitalization and compare them with those among three forex pairs and two commodity pairs.
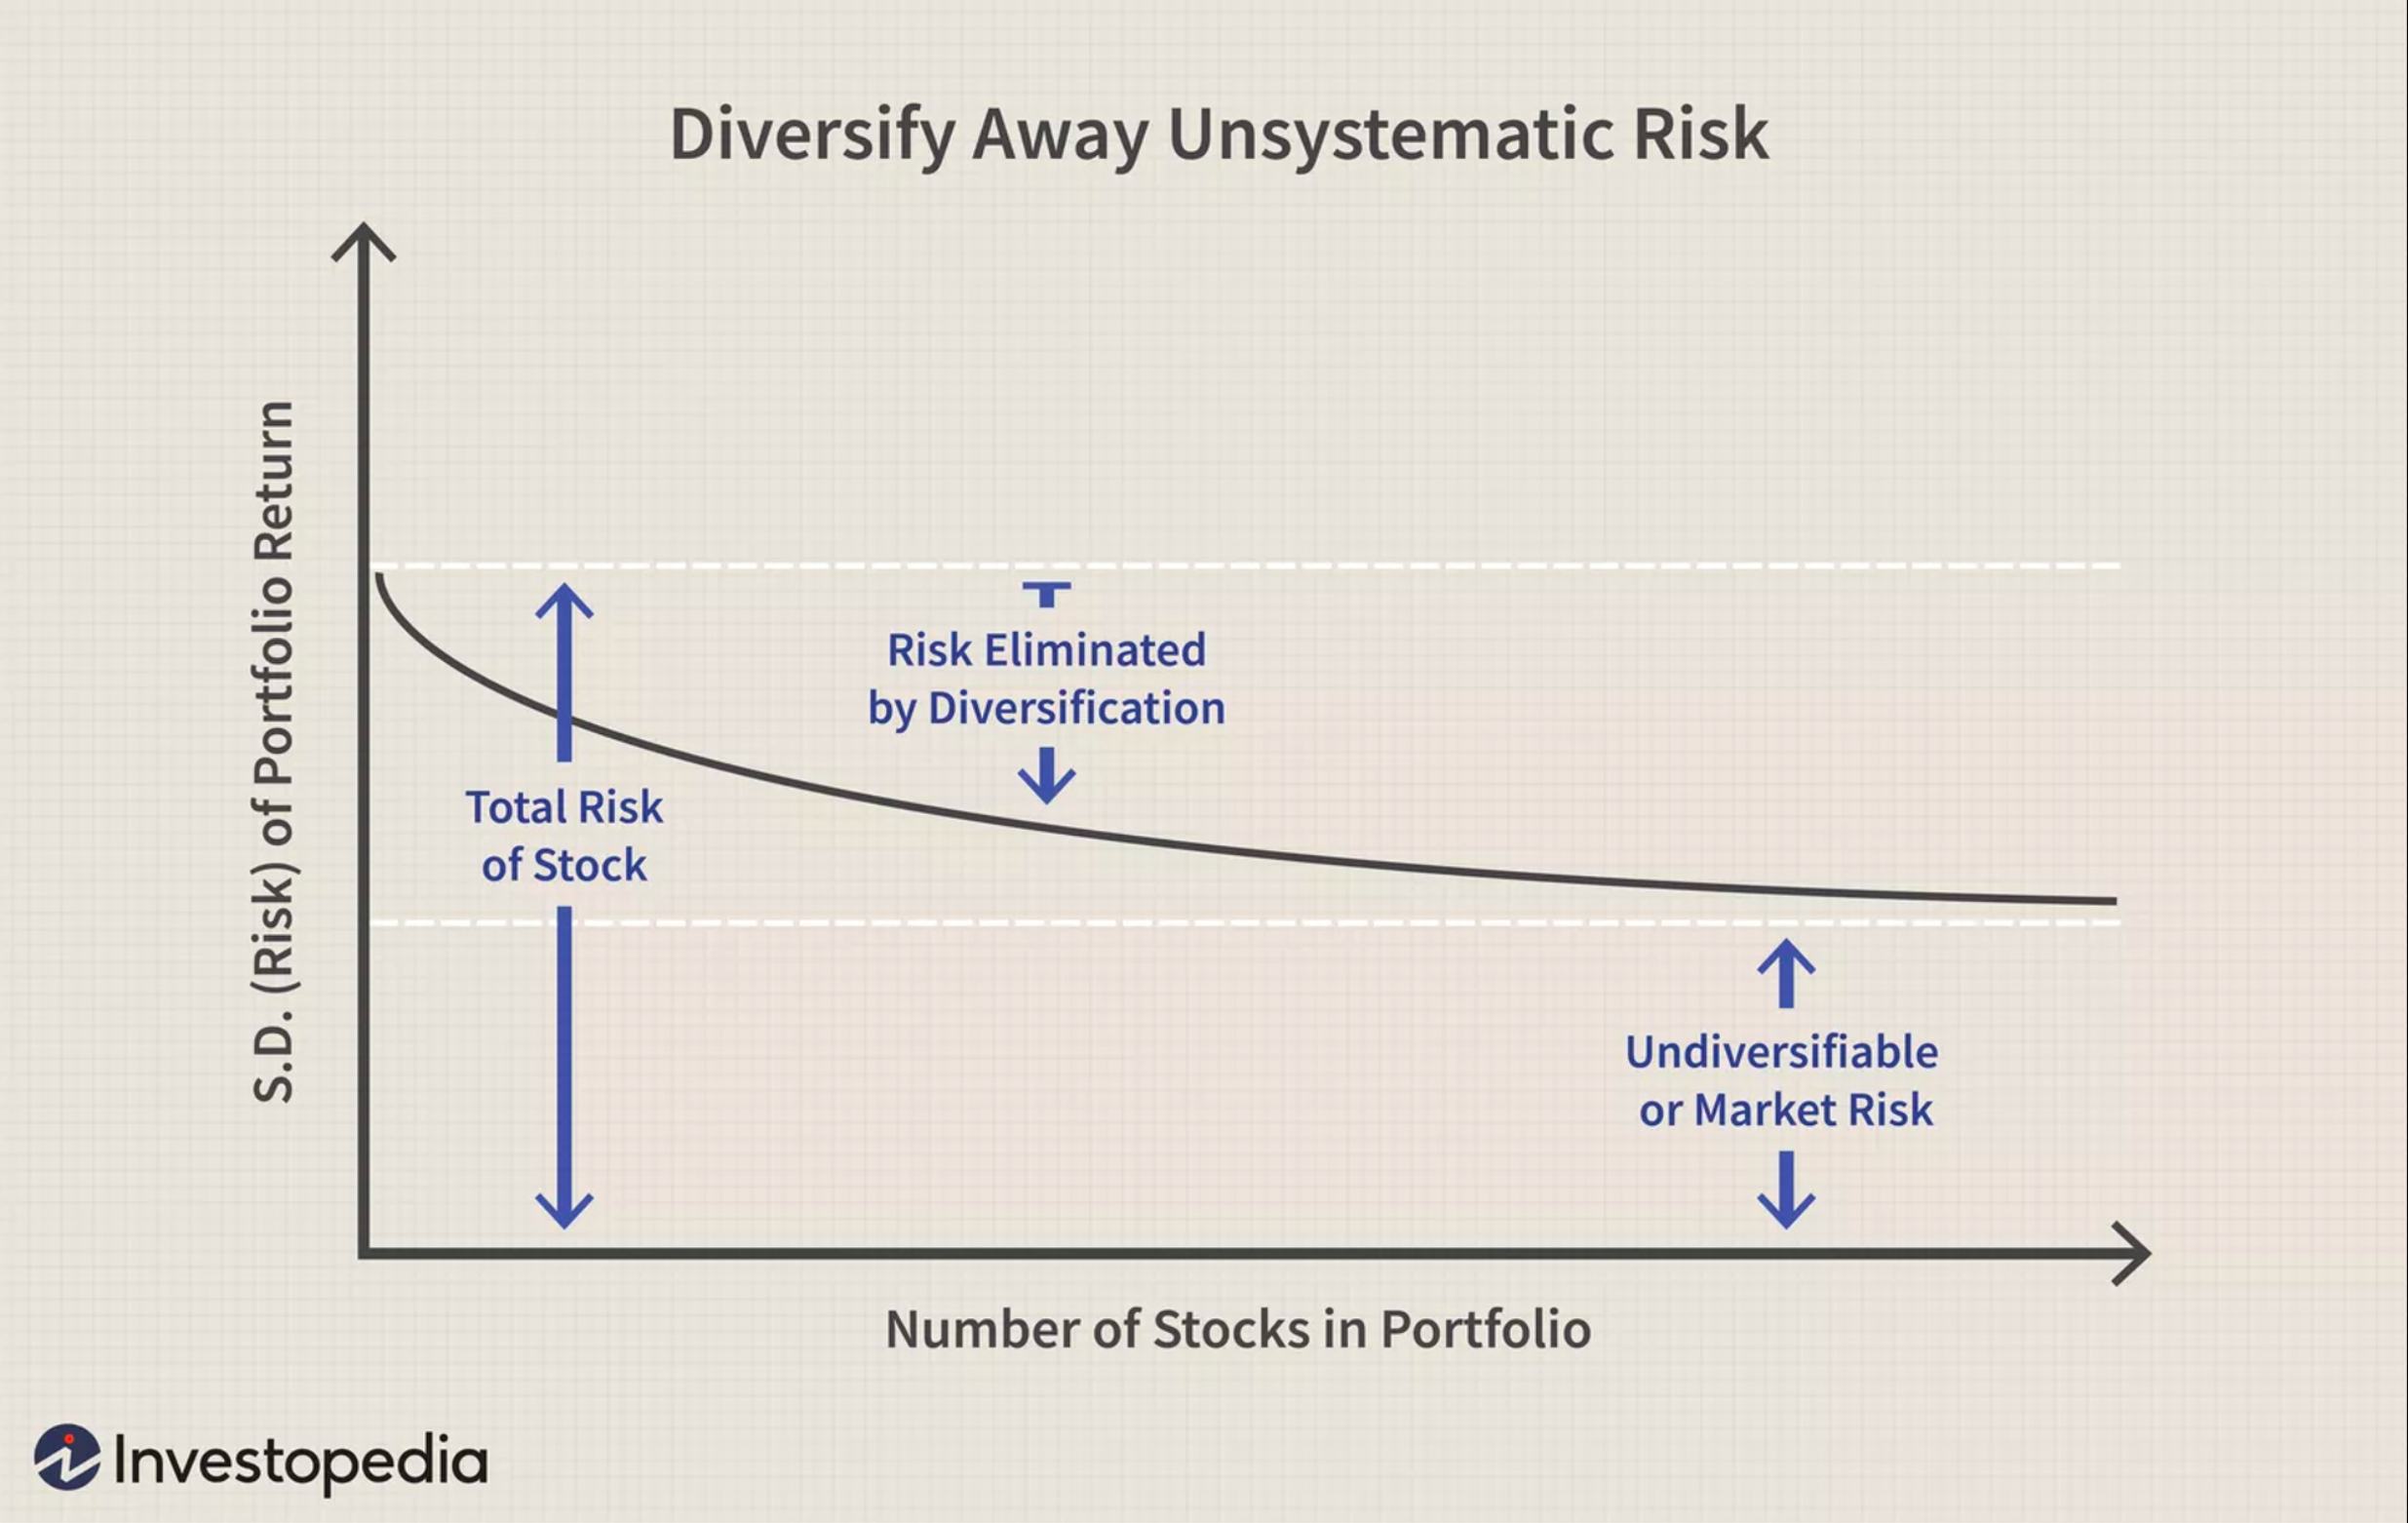
Basic intuition, supported by Modern Portfolio Theory (MPT), suggests that a portfolio combining a range of uncorrelated and anti-correlated assets should reduce risk per unit of return compared to a highly correlated asset portfolio.
This assumes that Open Interest is similarly skewed (either long or short) across all assets. Ostium’s risk-scoring system, which we will delve into later, leverages formulas widely used in MPT to quantify this risk. Before exploring Ostium’s adaptation of modern portfolio theory, let’s review it and its benefits.
Modern Portfolio Theory (MPT) Overview
Definition and Origin
Modern Portfolio Theory (MPT) is a mathematical framework developed by American economist Harry Markowitz in 1952, for which he later won a Nobel Prize. It is designed to maximize portfolio returns for a given level of risk.
Key Concepts
Diversification
MPT emphasizes diversifying investments to balance high-risk, high-return assets with low-risk, low-return ones.
Risk-Return Tradeoff
It focuses on constructing portfolios that offer the highest possible returns for a given level of risk.
Risk Aversion
The theory assumes investors prefer less risky portfolios for a given level of return, advocating for investment in multiple asset classes.
Risk Assessment
MPT evaluates the risk and return of an investment in relation to how it affects the overall portfolio’s risk and return. Risk is measured through statistical metrics like variance and correlation. It considers that the risk of a portfolio is not just a sum of its parts due to asset correlations.
Portfolio Construction
The expected return of a portfolio is the weighted sum of the individual assets' returns. Portfolio risk is derived from the variances of each asset and the correlations between each pair of assets.
MPT Benefits
MPT helps build efficient, diversified portfolios. The advent of ETFs has further enabled investors to easily access a wide range of asset classes. For example, combining stocks with government bond ETFs can reduce portfolio risk due to their negative correlation.
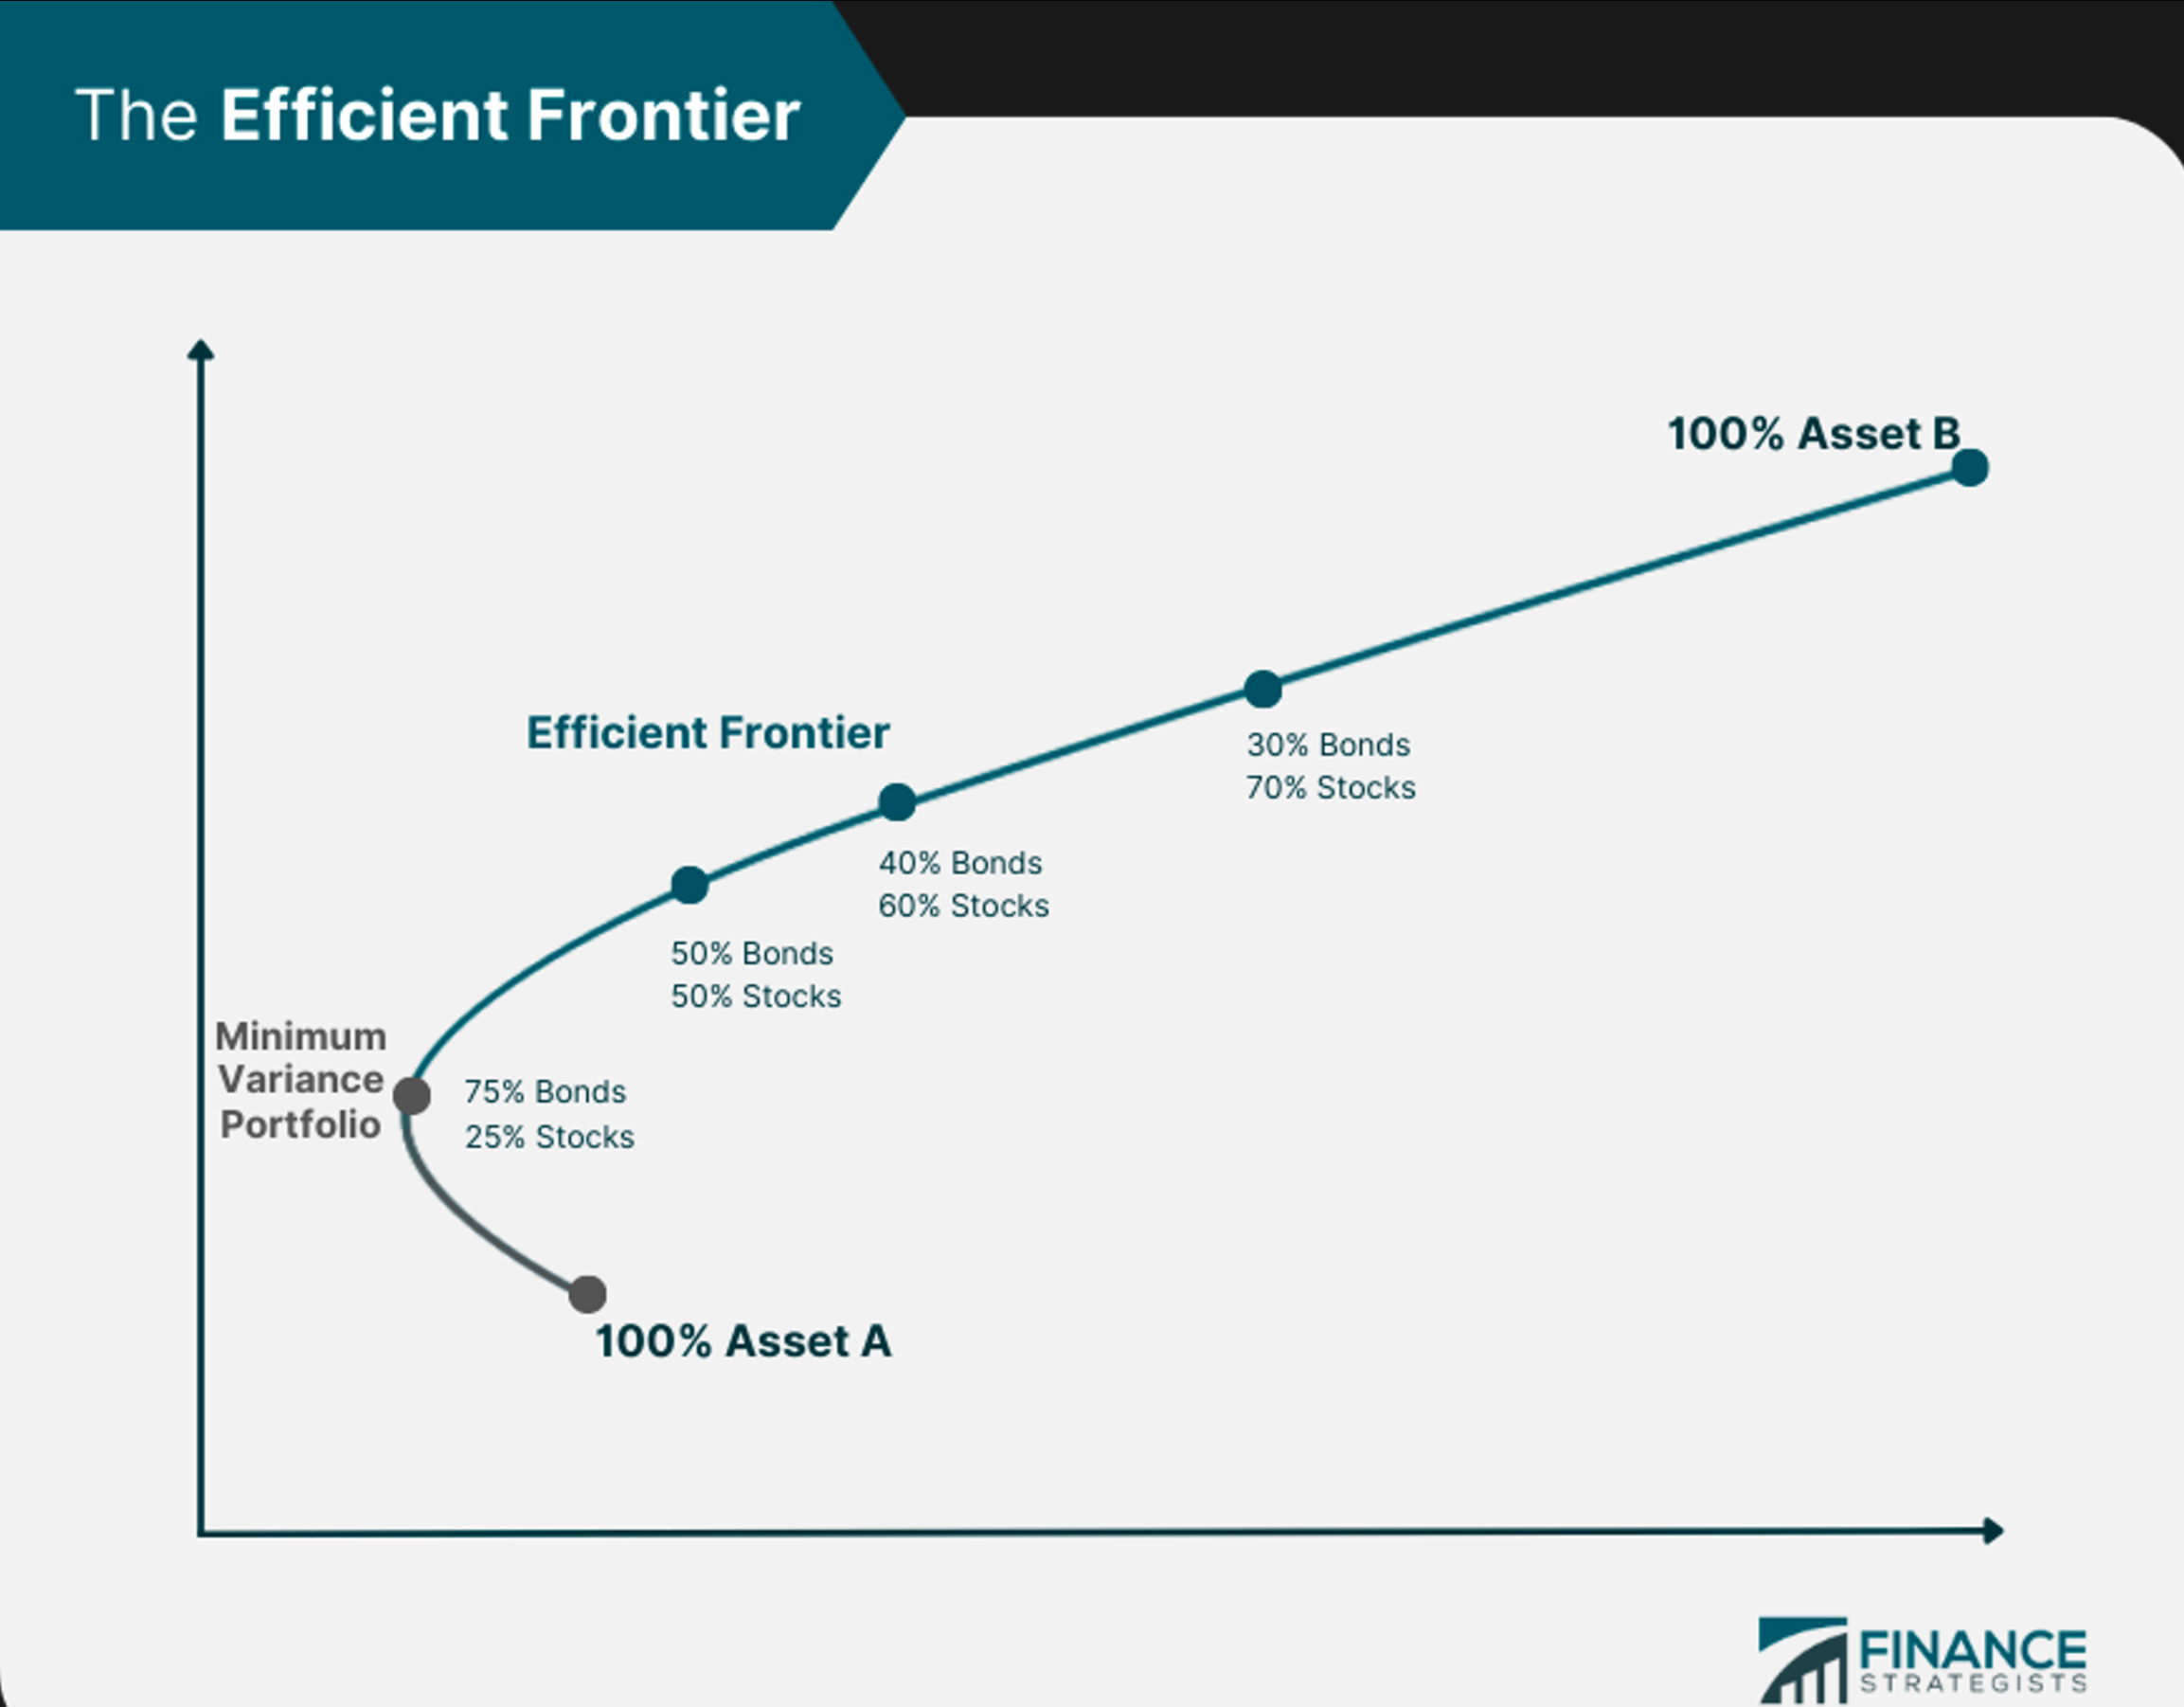
Efficient Frontier in MPT
The Efficient Frontier in Modern Portfolio Theory (MPT) represents the set of optimal portfolios offering the highest expected return for a given level of risk or the lowest risk for a given return. Key aspects include:
- Optimal Portfolios: Portfolios on the Efficient Frontier are optimal, balancing risk and return effectively.
- Diversification: These portfolios are typically diversified to reduce risk without sacrificing returns.
- Risk-Return Trade-Off: The curve illustrates the trade-off between risk and return, with higher returns requiring acceptance of more risk.
- Graphical Representation: On a graph, the Efficient Frontier is a curve with risk (standard deviation) on the x-axis and expected return on the y-axis. Portfolios above the curve are unattainable, while those below are sub-optimal.
- Investor Choice: Investors choose portfolios along the curve based on risk tolerance.
- Dynamic Nature: The Efficient Frontier can shift with changing market conditions.
In portfolio management, the Efficient Frontier guides asset allocation to maximize returns for a desired risk level, aiding in informed investment decision-making.
Application in DeFi Context
In the context of decentralized finance (DeFi) and Ostium’s Imbalance Score, MPT's principles of diversification and risk-return optimization are particularly relevant. The theory's approach to understanding and balancing various risk factors is analogous to how Ostium's model assesses and manages risks in multi-asset pools, especially in the volatile and diverse world of crypto assets.
The remainder of this research article will focus on exploring Ostium's Imbalance Risk Score. We aim to understand better how asset diversification can enhance capital efficiency and act as a robust risk management tool in multi-asset, single-pool perpetual DEXes. By integrating various assets with lower correlations, we can potentially revolutionize the risk profile of these platforms, introducing a more resilient and efficient trading environment.
Ostium’s Imbalance Score Intuition
The upcoming sections delve into Ostium's Imbalance Score, a metric designed to quantify risk in multi-asset pools. Readers are directed to Ostium’s full paper for a detailed mathematical exposition.
Critical Components of Market Risk Quantification
Summing Imbalances Across Assets
- Example: In a pool with two assets, A and B, both with $100 long imbalances, a simple risk calculation might sum these imbalances to $200.
- However, this method overlooks the crucial factor of asset correlation.
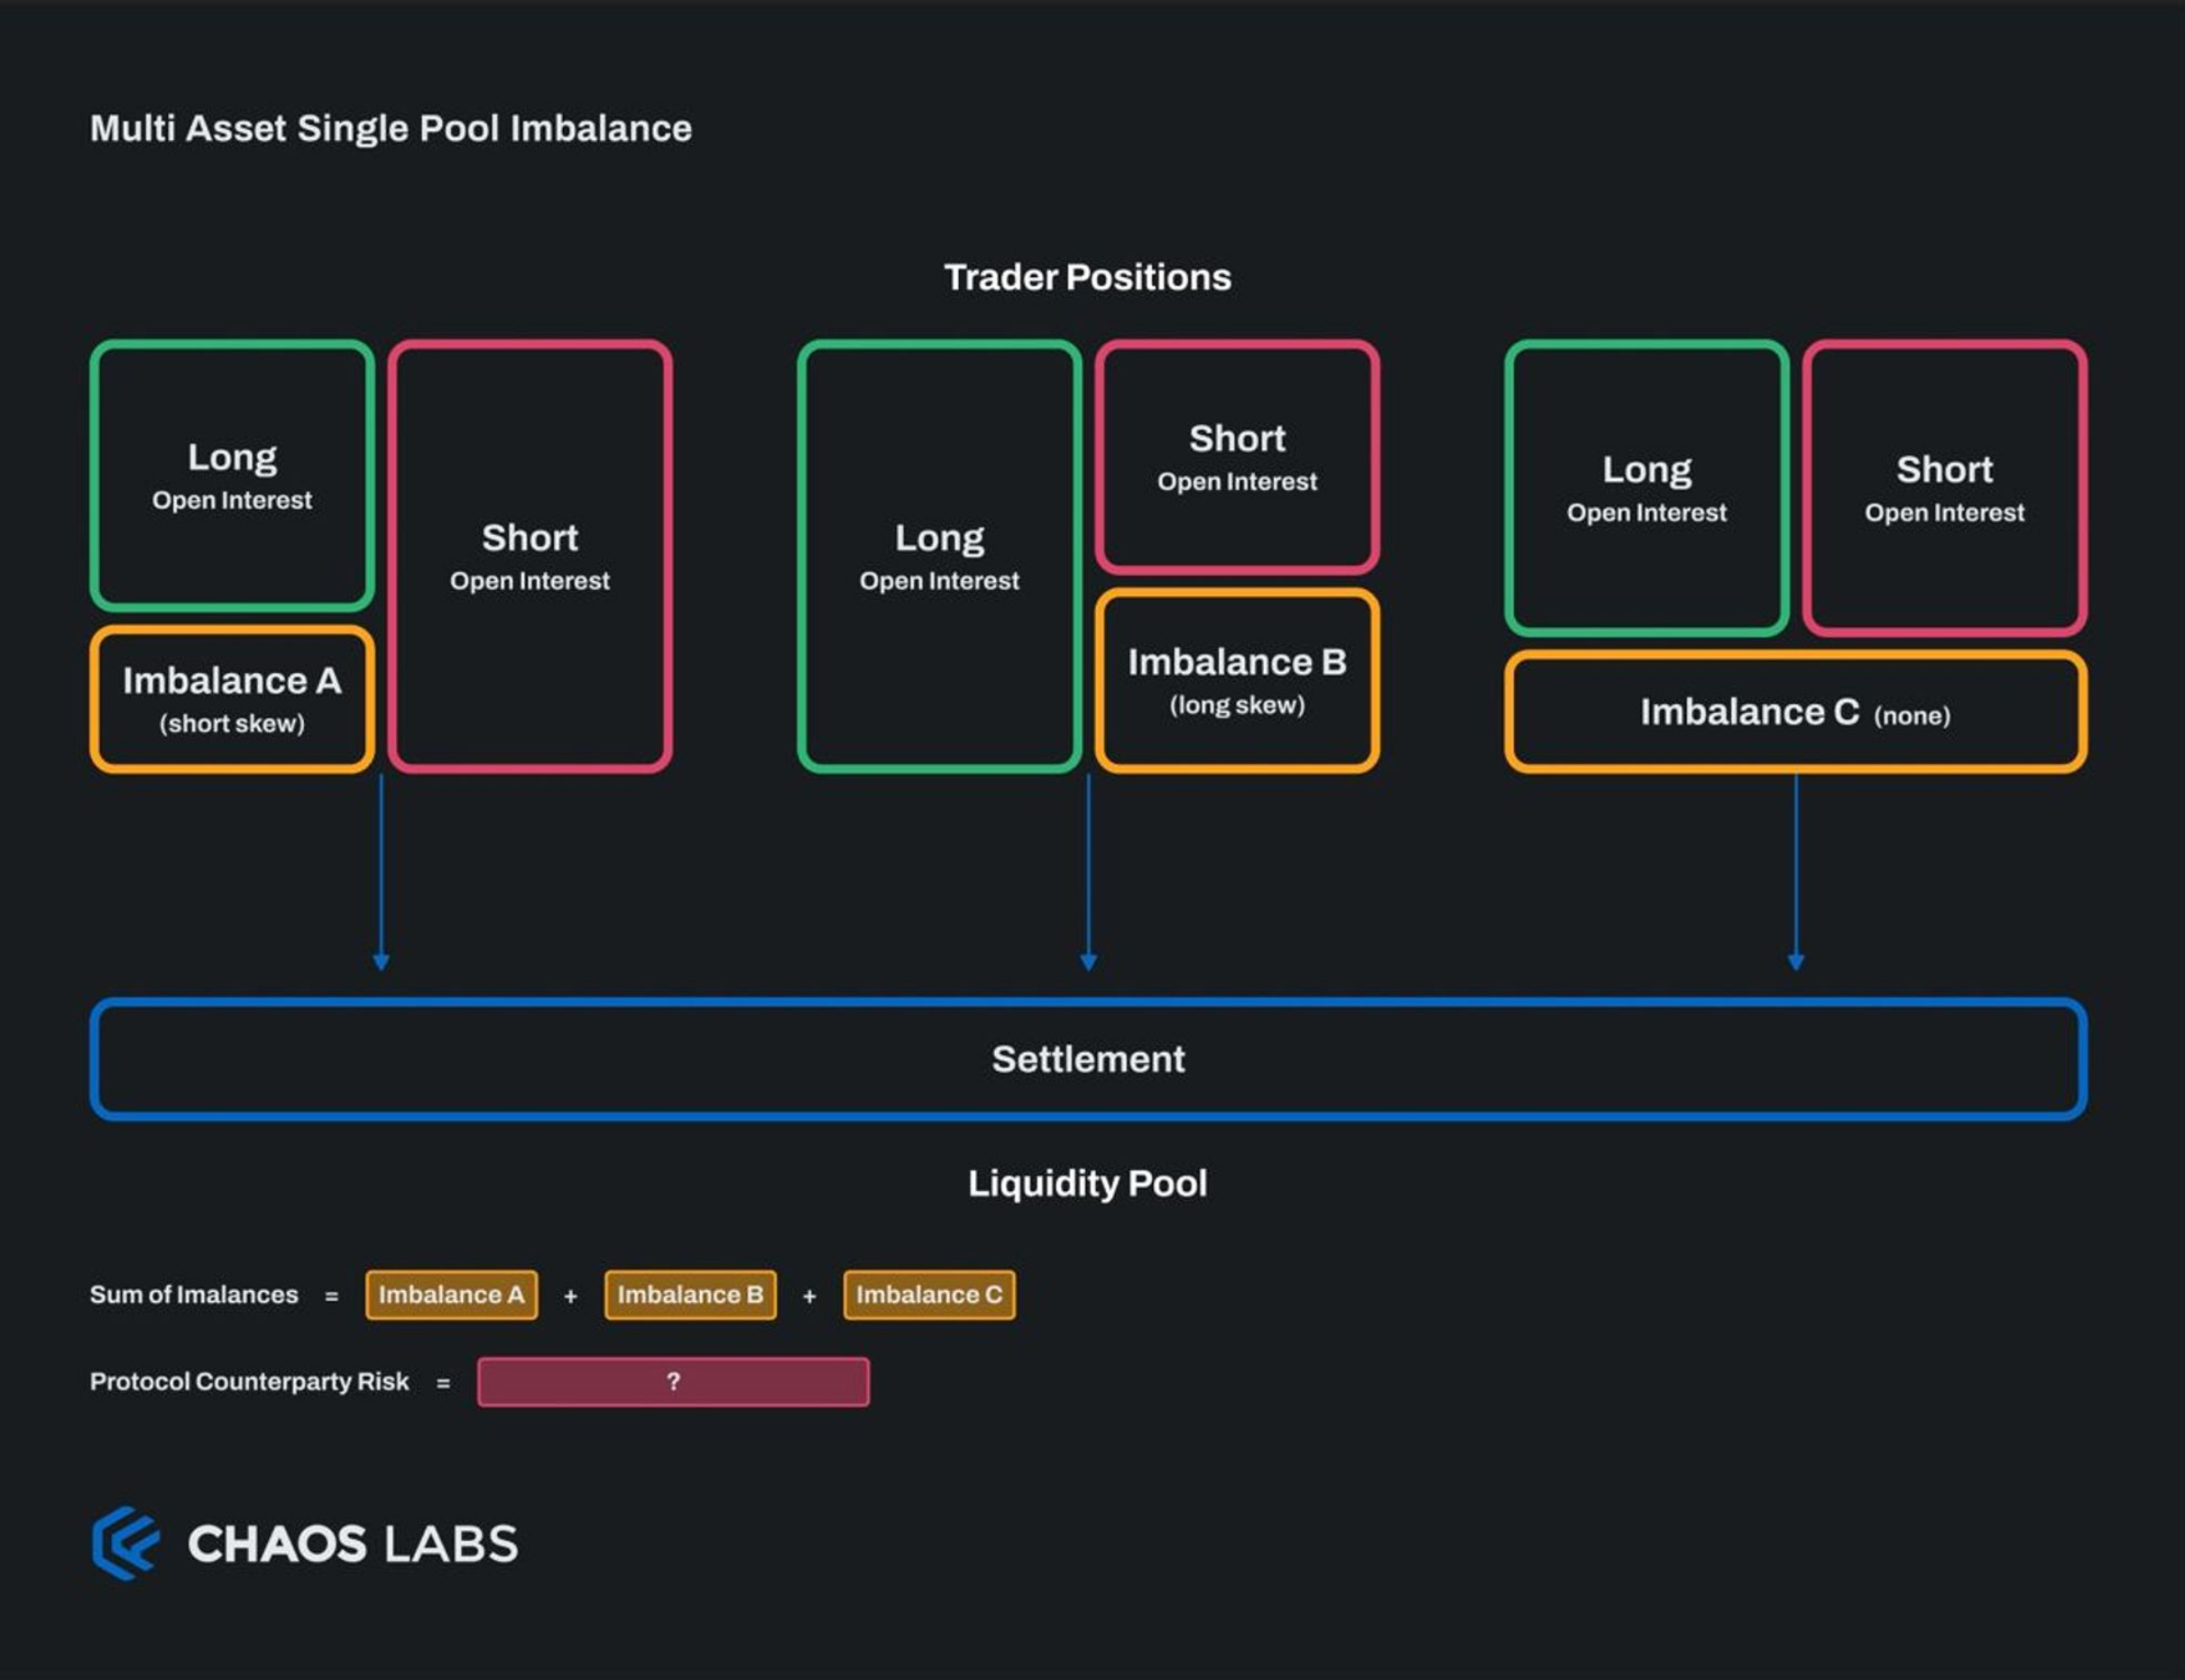
Incorporating Asset Correlation
- Incorporating correlations alters risk perceptions significantly. If assets A and B are perfectly inversely correlated, their combined risk calculation may result in zero.
- This highlights the importance of correlation in risk assessment and its limitations, especially during high volatility or unpredictable market events (“black swan” events).
Integrating Asset Volatility
- Adding the dimension of volatility to the risk assessment is crucial. For instance, if asset A is twice as volatile as B and their prices move inversely, the total unbalanced profit and loss (PNL) don't neutralize to zero but results in a net value.
- This shows the need for a more nuanced risk assessment model that simultaneously accounts for imbalance, volatility, and correlations.
These examples underscore the need for a comprehensive and sophisticated approach to risk quantification in DeFi, moving beyond simple summation to a multifaceted analysis considering imbalances, correlations, and volatilities.
Market Risk Pillars
The preceding section utilized various examples to foster a foundational understanding. We will formally delineate the distinct components that constitute Market Risk within the framework of the Imbalance Score methodology we are introducing. This step involves a detailed and systematic definition of each pillar, ensuring a comprehensive grasp of the factors integral to Ostium’s proposed risk assessment model.
Asset Volatility
- Definition: Asset volatility measures the degree of price fluctuation of an asset over time.
- Quantification: It is quantified using a vector of standard deviations of returns calculated from historical price data.
- Application: This metric is customized for each asset over varying time intervals (daily to intraday), capturing the inherent risk in price movements and serving as a crucial input for the market risk assessment.
Asset Correlation
- Description: Asset correlation examines how the values or returns of different assets are interrelated.
- Measurement: It is assessed using a Pearson Correlation Matrix based on historical data, allowing for a detailed understanding of the interplay between different assets.
Where:
- (i,j) represents the correlation coefficient between asset i and asset j.
- The matrix values range from -1 to +1, where +1 indicates perfect positive correlation, -1 indicates perfect negative correlation, and 0 implies no correlation.
Asset Imbalance
- Overview: Asset imbalance refers to the disparities in long and short open interest positions across assets at a given time.
- Measurement Approach: It is represented by a vector detailing the open interest imbalances for each asset in USD, providing a clear financial perspective on the positions' skew.
Imbalance Score
- Concept: The Imbalance Score is Ostium's innovative metric to gauge the protocol's counterparty risk.
- Behavior: It responds to changes in asset volatilities, correlations, and imbalances, increasing or decreasing based on the collective risk these components present.
- Utility: This metric offers a succinct yet comprehensive view of the risk landscape, adapting to evolving market conditions.
In other words, the Imbalance Score for a multi-asset single pool will factor each pillar and look as follows:
Imbalance Score Review
The Imbalance Score metric is constructed by evaluating each contributing factor and understanding their roles before integrating them into a more complex model.
The Ostium research paper compares the Imbalance Score to concepts from Modern Portfolio Theory, mainly drawing parallels to Portfolio Return Variance. Readers interested in exploring this analogous relationship in greater detail are encouraged to refer to the full Ostium paper.
Below, we briefly review the construction of the formula.
Vector Representation of Implied Imbalance Risk Per Asset
We can compile the Implied Risk metric into a vector called K, which considers imbalance and volatility data for each asset at time t. In this vector, $K_i$ represents the IIR for the ith asset.
We utilize the Euclidean Norm for K to measure the risk within the system at a specific moment. This approach streamlines the diverse risk factors of individual assets into one unified value, simplifying the understanding and communication of the overall risk profile.
However, this scalar value does not account for the correlation between traded assets.
Factoring in Correlation
To address the lack of correlation consideration, we reintroduce the asset correlation matrix R. This matrix, detailing correlations between different assets, adds a crucial dimension to our risk assessment. This significantly enhances the risk metric and elevates our risk assessment from a single-dimensional to a multi-dimensional analysis, better capturing the complex dynamics of diversified asset pools. We multiply by the transpose of K to yield a 1x1 vector.
The current calculations result in squared units, specifically (USD²/day²), due to the multiplication of vectors and matrices. These units must align with the ||K|| units in (USD/day) for consistency and clarity. Therefore, an adjustment in the calculation method is required to convert the units back to (USD/day), ensuring the results are consistent and interpretable. Together, we have derived the Imbalance Score (IS).
Imbalance Score Through Examples
Let's examine two hypothetical scenarios to demonstrate the Imbalance Score's practical utility. These examples will help illustrate how this score uniquely captures the risk associated with specific sets of assets and their imbalances.
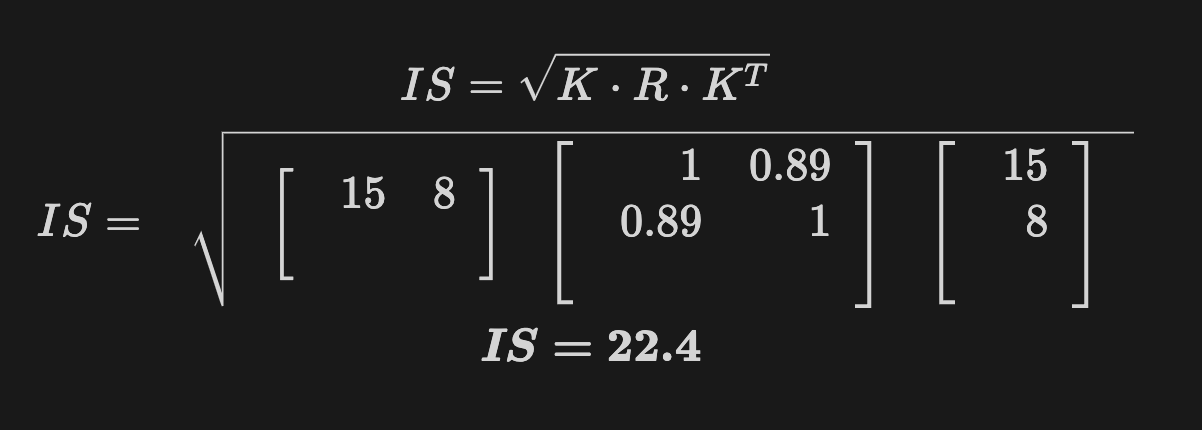
Scenario 1
- Assets and Imbalances: Imagine we have a Bitcoin (BTC) imbalance of $500 (long) and an Ethereum (ETH) imbalance of $200 (long).
- Volatility (Standard Deviations): Based on historical data, BTC and ETH have standard deviations of daily returns at 0.03 and 0.04, respectively.
- Correlation: The correlation between BTC and ETH is recorded at 0.89.
In this scenario, the Imbalance Score will consider the individual imbalances of BTC and ETH, their respective volatilities, and their strong correlation. This comprehensive approach provides a more nuanced view of the risk profile, reflecting the magnitude of these significant cryptocurrencies’ imbalances and interconnected dynamics.
Let’s start by computing the inputs under this scenario:
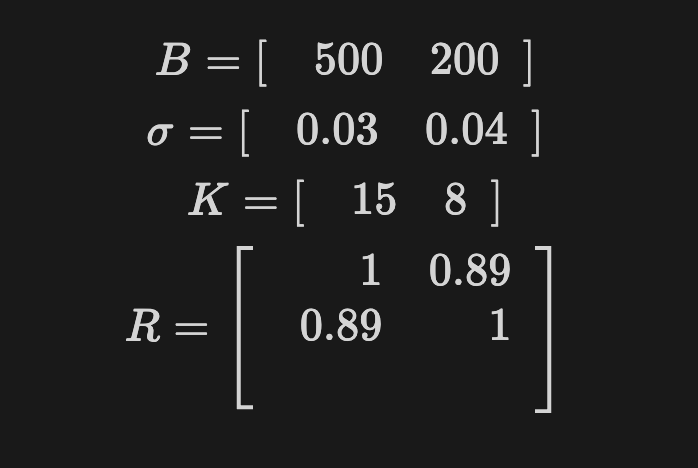
Calculating the Imbalance Score, we get:
Scenario 2
- Assets and Imbalances: In this scenario, we adjust the variables from Scenario 1. We now have a Bitcoin (BTC) imbalance of -$500, indicating a short position, while maintaining the Ethereum (ETH) imbalance at $200 (long).
- Volatility (Standard Deviations): The standard deviations of daily returns for BTC and ETH remain at 0.03 and 0.04, respectively, as in Scenario 1.
- Correlation: The correlation between BTC and ETH continues to be 0.89.
In this scenario, the Imbalance Score will again consider the imbalances, volatilities, and correlation. However, the significant change here is the shift in BTC's position to a short skew. This alteration in the BTC imbalance will impact the overall risk profile differently compared to Scenario 1. The Imbalance Score will reflect this change, showcasing its sensitivity to imbalances' direction, magnitude, and relationships between assets. Computing the imbalance score yields:
Comparing Both Scenarios
In these two scenarios, despite the different risk profiles, both share the same Cumulative Imbalance Implied Risk:
This equivalence in both imbalance-implied risk metrics measures the cumulative risk without considering the direction of the imbalances or their correlations. However, our intuitive understanding suggests that Scenario 2 should carry less risk due to the hedging effect:
- In Scenario 2, BTC's short imbalance is a partial hedge against ETH's long imbalance, thanks to their positive correlation.
The Imbalance Score (IS) accurately captures these nuances:
- Scenario 1's IS: The IS is more significant than K1, reflecting increased counterparty risk due to the positive correlation between BTC and ETH, both skewed long.
- Scenario 2's IS: Here, the IS is smaller than ||K2||, illustrating how the inversely skewed imbalances (BTC short and ETH long) contribute to risk mitigation.
Thus, the Imbalance Score displays effectiveness in discerning the subtleties of different market scenarios, going beyond mere cumulative risk measurement to consider the direction of imbalances and their inter-asset correlations.
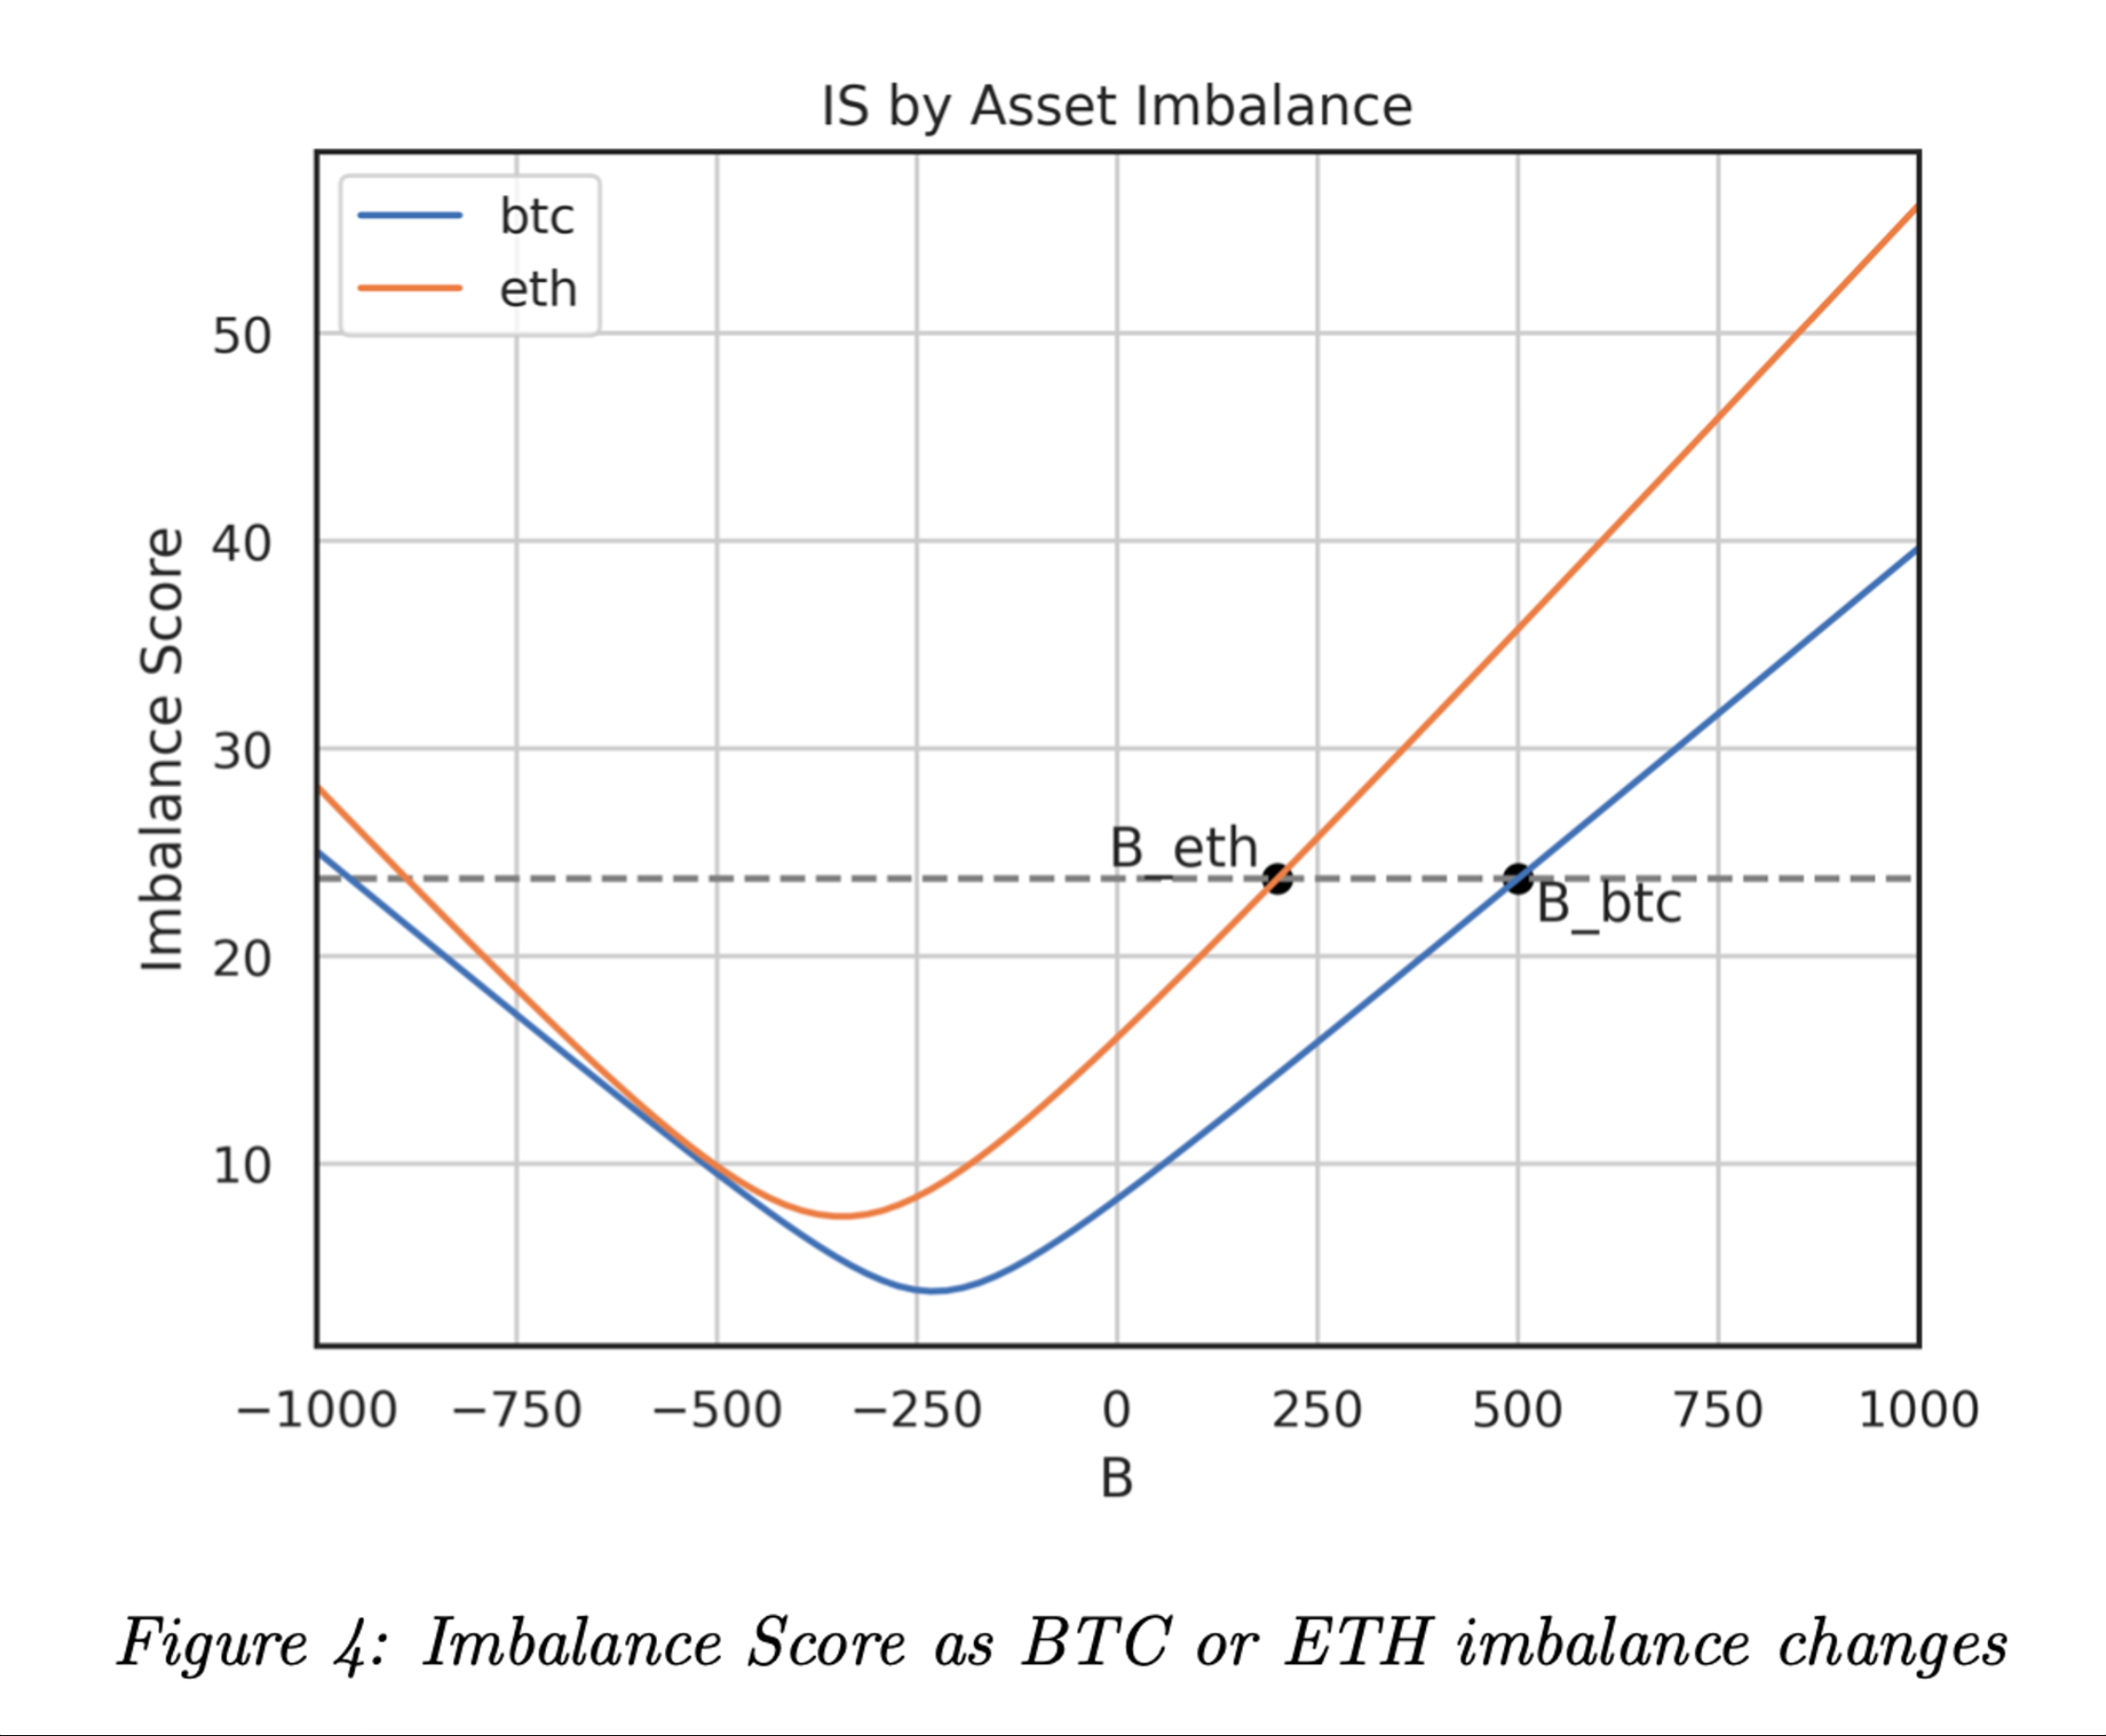
Further, plotting the total IS against an individual asset’s imbalance allows us to visually grasp our intuition about the optimal set of imbalances to minimize counterparty risk:
This section comprehensively examined the framework for assessing counterparty risk within a multi-asset portfolio. The process involved:
- Defining Parameters: Initially, we established the boundaries and limitations of our analysis.
- Deriving the Imbalance Score: We then developed the Imbalance Score, a singular metric encapsulating total risk. This metric integrates each asset's historical volatility, correlation, and current imbalance as inputs.
- Practical Illustration: We concluded by presenting real-world scenarios to demonstrate the Imbalance Score's practical utility and effectiveness in varying market conditions.
This section offered a theoretical and practical understanding of evaluating and managing counterparty risk in a dynamic multi-asset trading environment.
Simulated Risk Profiles of Crypto and RWA Portfolios
Objective of Simulation
- Using the Imbalance Score, we aim to simulate and compare the risk profiles of portfolios containing cryptocurrencies and Real World Assets (RWAs). We hypothesize that a diversified portfolio, including RWAs, which generally exhibit lower inter-asset correlation, will consistently show a reduced risk profile.
Simulation Approach
- Initial Imbalance Impact: We'll first simulate imbalances in various portfolios, examining the initial impact on the Imbalance Score without adjusting for the influences of volatility or correlation.
- Focusing on Volatility and Correlation: The next step involves standardizing volatility and imbalance across portfolios. Then, we plot the results on a dispersion chart to highlight how incorporating less-correlated RWAs in a multi-asset single-pool portfolio reduces overall risk.
Data Specifications for Simulations
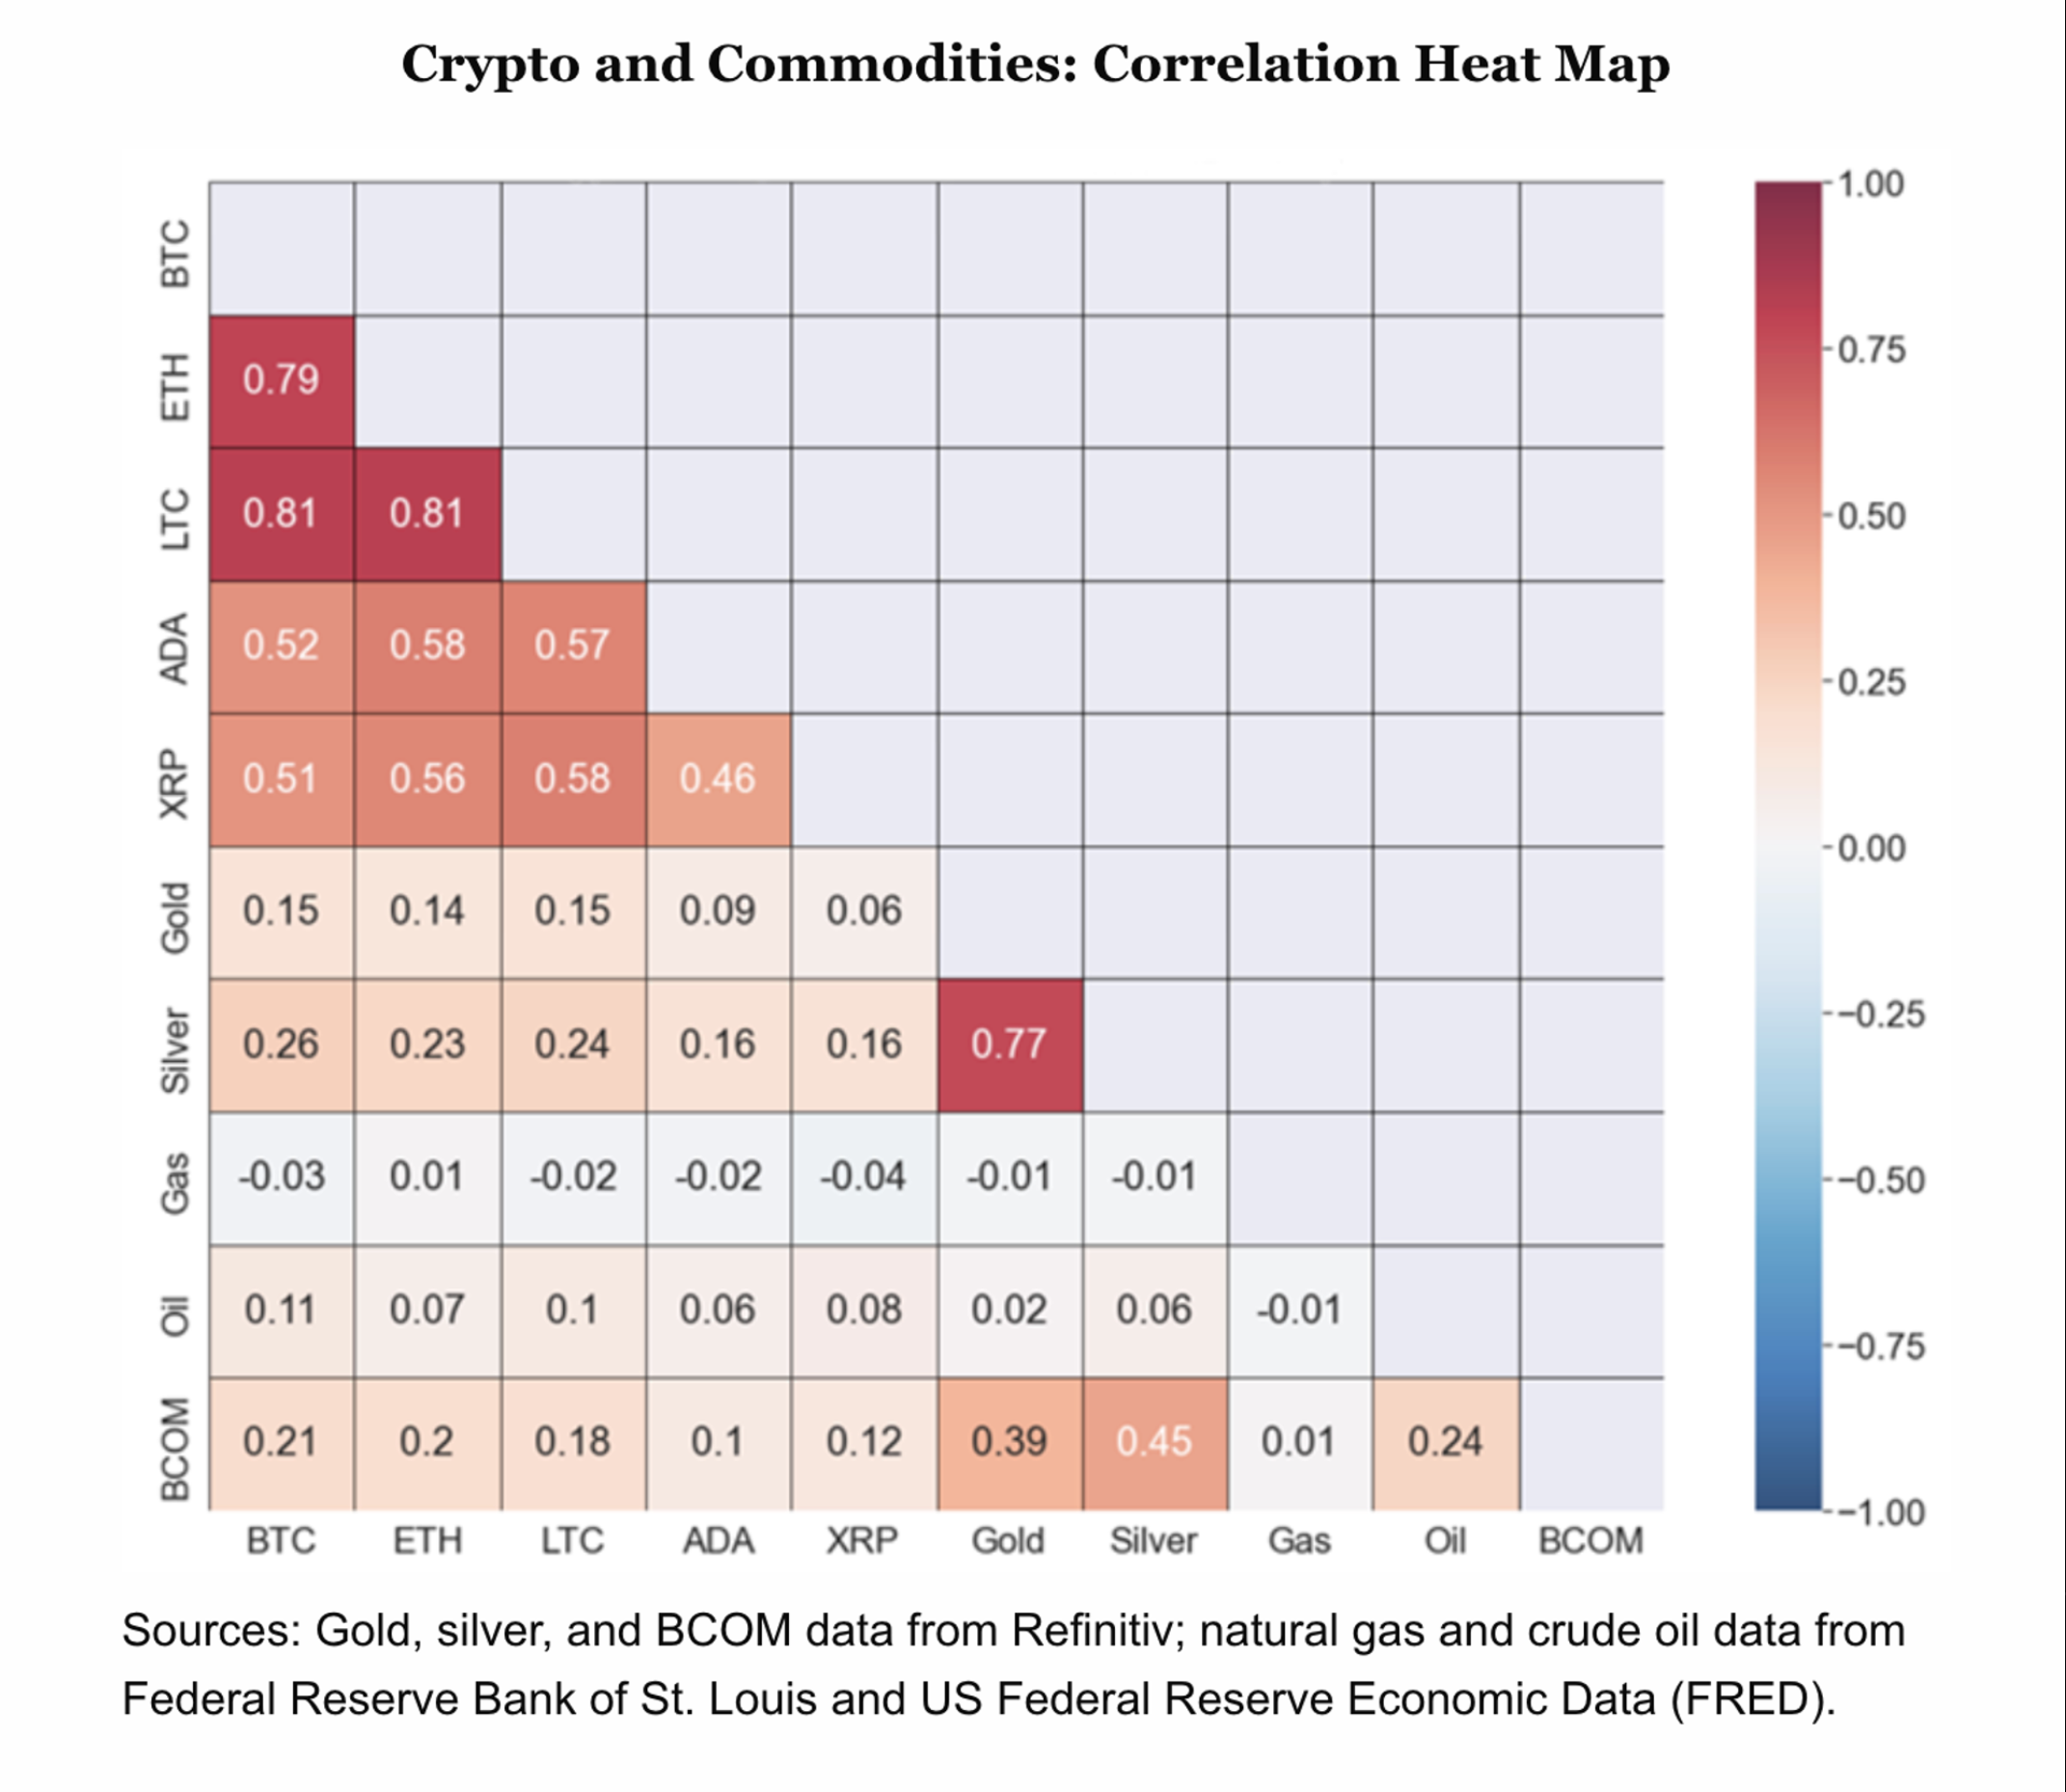
- Assets Included: The simulation incorporates five of the largest-cap, non-stablecoin crypto assets (BTC, ETH, SOL, XRP, BNB), the three most widely traded G10 currencies (EUR/USD, GBP/USD, USD/JPY), and the two most commonly traded commodities (XAU - Gold, WTI - Crude Oil).
- Data Period: The simulation uses data from the last two years, from September 2021 to September 2023.
- Time Unit: Daily price changes compute the period return, focusing on daily volatility.
Observations from Preliminary Data
- Figure 5 illustrates the higher volatility typically associated with crypto assets compared to RWAs.
- Figure 6 demonstrates that correlations among crypto assets are generally higher than those observed between selected RWAs.
These simulations are designed to provide empirical evidence supporting the hypothesis that RWA-inclusive portfolios can offer a more balanced risk profile, leveraging the benefits of diversification in the context of blockchain-based asset trading.
Simulation 1: Imbalance Score Only Simulation
Setting Up the Simulation
In this simulation phase, we categorize the previously mentioned assets into distinct portfolios. The characteristics of these assets, such as the standard deviation of returns and correlations, are based on the historical data specified earlier:
- Crypto Portfolio: Consists of BTC, ETH, SOL, XRP, and BNB.
- RWA Portfolio: Comprises XAU, WTI, EUR, GBP, JPY.
- Crypto+RWA Portfolio: A hybrid consisting of BTC, SOL, WTI, EUR, and XAU.
Simulation Process
- We simulate asset imbalances over 5,000 iterations for each of the three portfolios.
- The figure below illustrates the frequency distribution of Imbalance Scores resulting from these simulations.
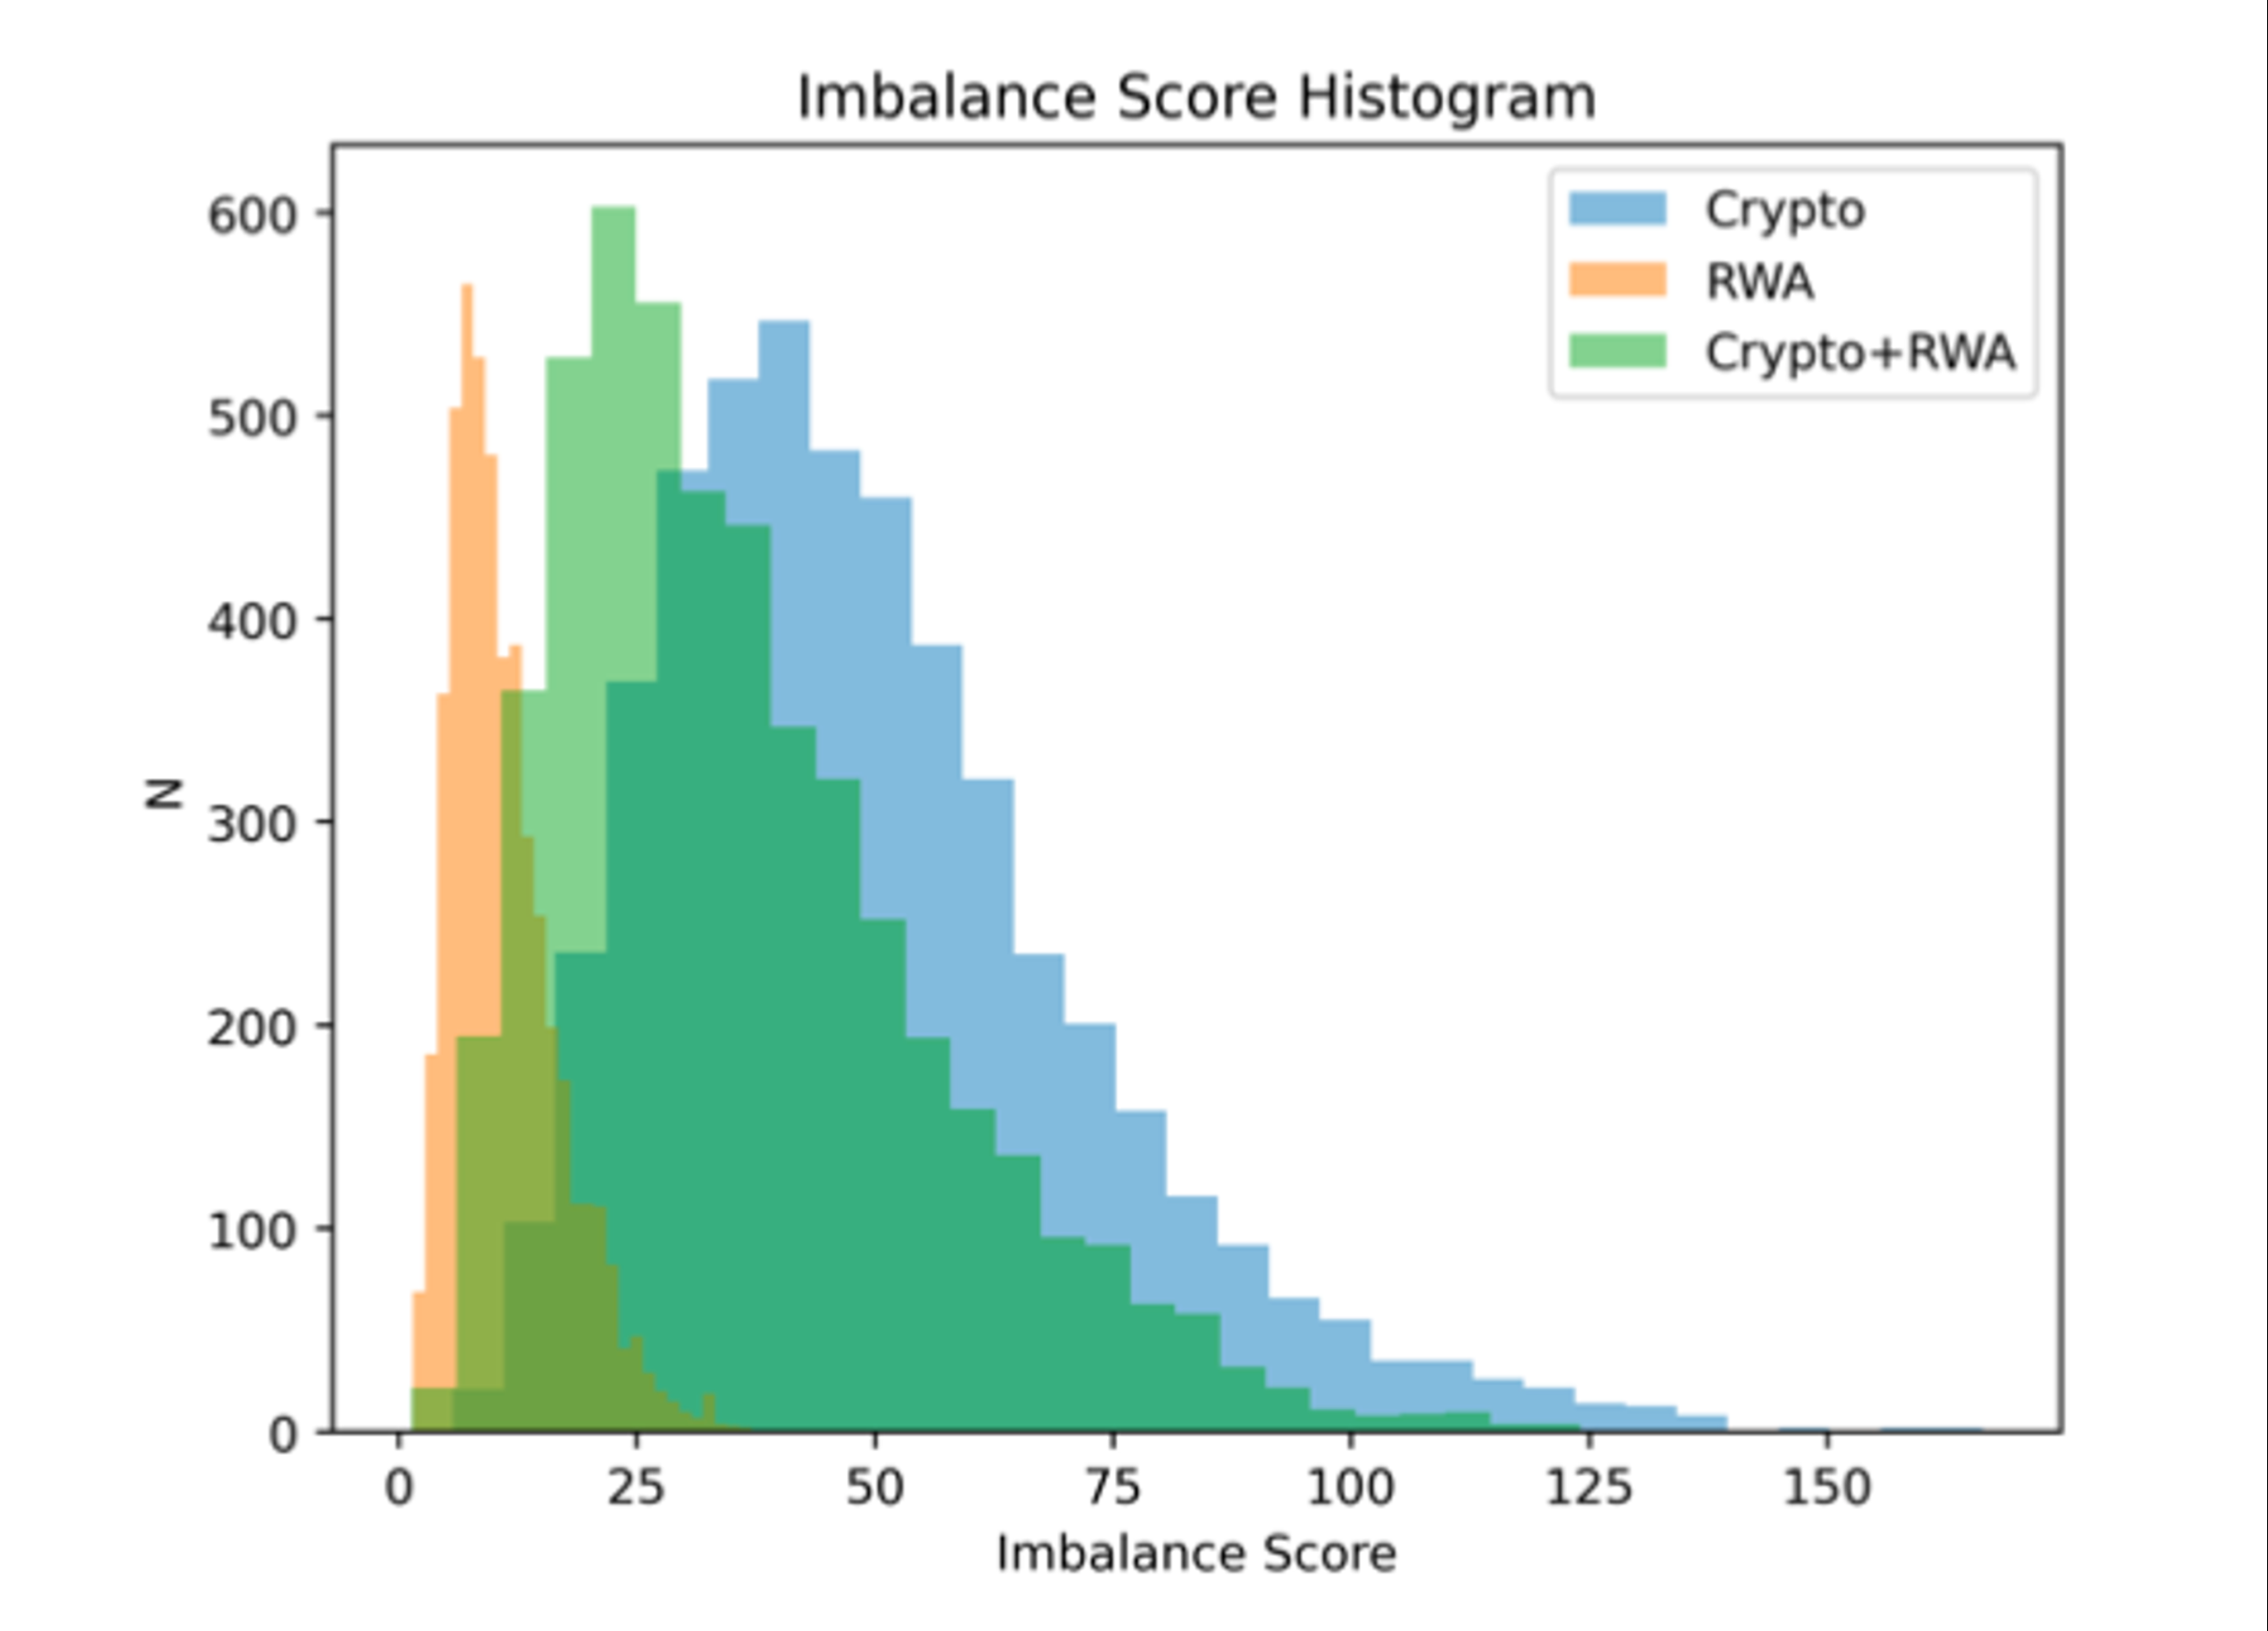
Key Observations
- The RWA-only and Crypto+RWA portfolios exhibit a lower mean and a narrower distribution of Imbalance Scores than the crypto-only portfolio.
- This trend suggests a pattern of reduced global risk, as quantified by the Imbalance Score, in portfolios that include RWAs.
Limitations and Considerations
- However, this initial analysis doesn't standardize for factors like volatility and the magnitude of imbalances.
- Due to the inherently higher volatility in crypto assets, the Crypto Portfolio naturally shows a higher mean and broader distribution of Imbalance Scores.
- As a result, the current plot primarily reflects the combined effect of volatility and inter-asset correlation on the Imbalance Scores rather than isolating the impact of correlation alone.
In summary, while these initial findings indicate lower risk in RWA-inclusive portfolios, further nuanced analysis is required to isolate and understand the specific impact of inter-asset correlation on the Imbalance Scores.
Simulation 2: Standardizing for Imbalance & Volatility
Objective of the Second Simulation
- This simulation addresses the previous shortcomings by contrasting the Imbalance Scores (IS) with ∥K∥, a measure of cumulative risk accounting only for imbalance and volatility.
Rationale Behind the Approach
- Recall that our risk analysis initially considers three key factors: volatility, correlation, and imbalance. To precisely understand the impact of correlation on risk, we compare ∥K∥ — capturing volatility and imbalance — against IS, which encompasses all three elements.
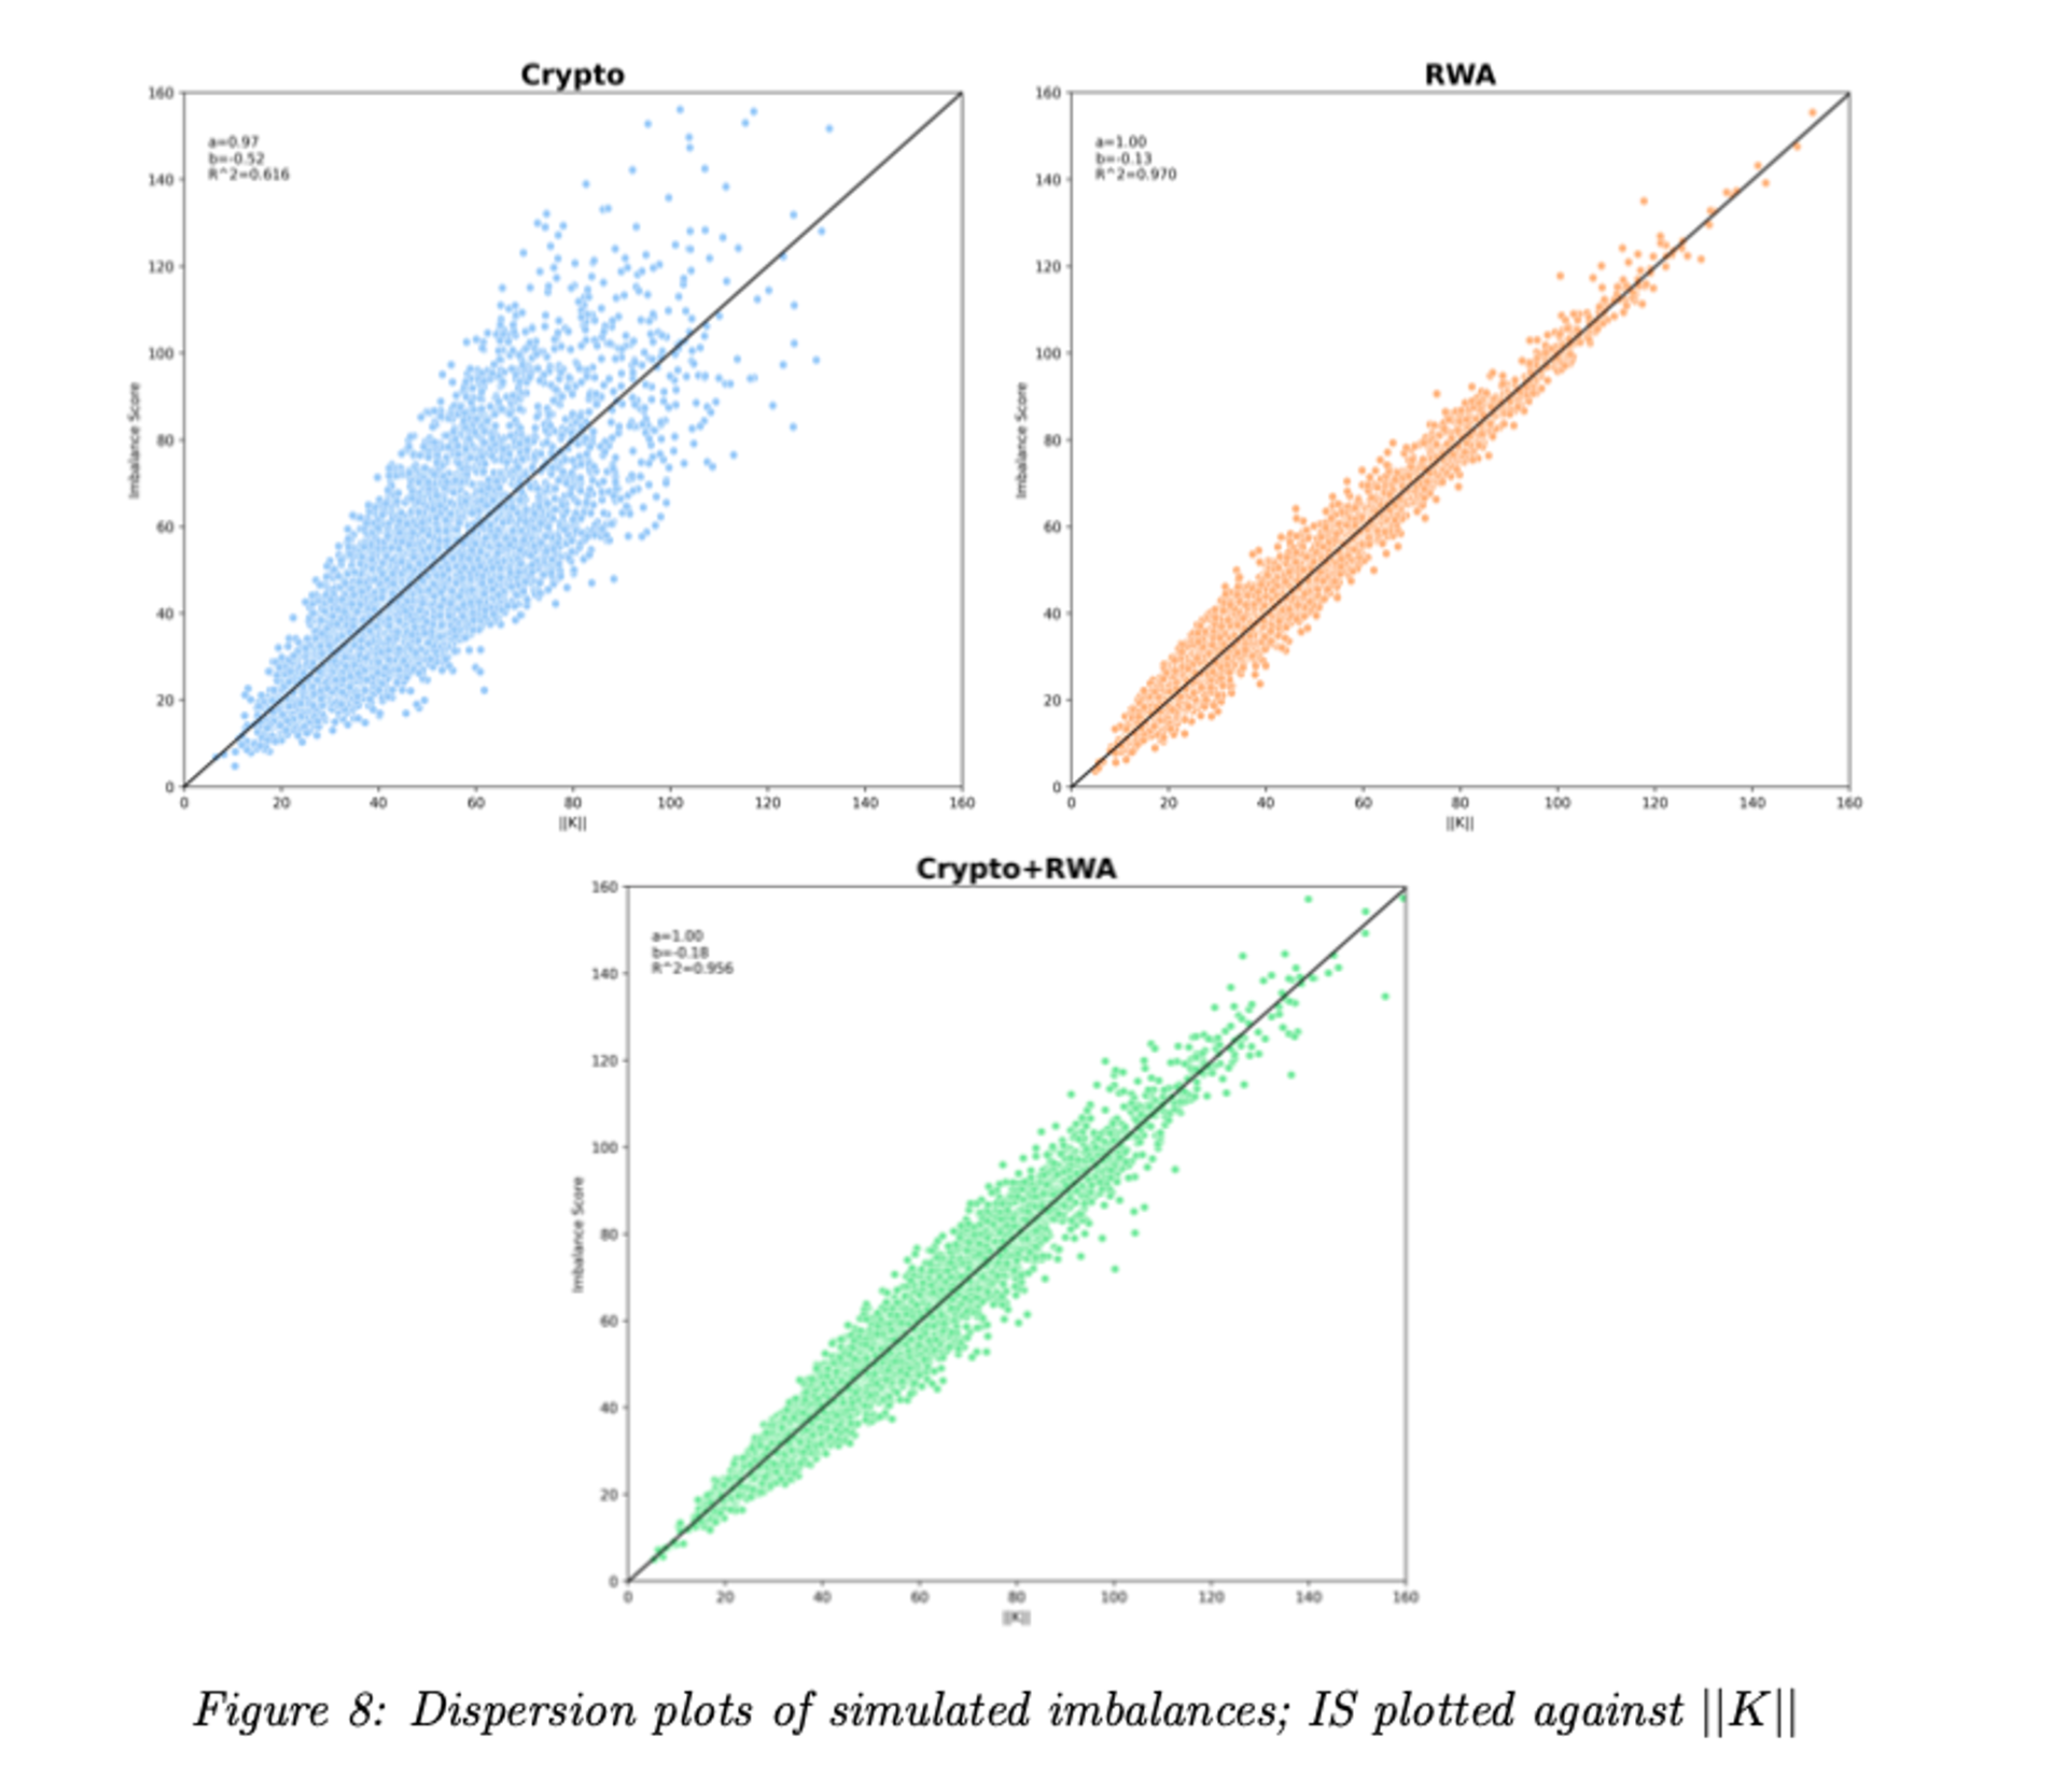
- Dispersion plots demonstrates that for a given ∥K∥, imbalances in the crypto portfolio are more dispersed from the central line, indicating a higher variability in the IS.
- The central black line represents the IS as a function of ∥K∥ under the assumption of independent portfolio assets. A data point above this line suggests that total cross-asset correlation has amplified the IS, while a point below indicates a reduction in IS due to correlation.
- Quantitatively, the crypto portfolio's R² of 0.616, compared to 0.970 and 0.956 for the other two portfolios, supports the inference. Values closer to 1 signify less variability in IS for the same ∥K∥, indicating that adding RWAs to a crypto-only portfolio in a ViPEX environment mitigates total risk.
Simulations Insights
- Whether results are standardized or not, a consistent finding emerges: a crypto-only portfolio inherently carries more imbalance risk.
- Introducing Real-World Assets into such portfolios lowers the IS variability.
- These simulations jointly reinforce the conclusion that diversification with RWAs in a crypto-dominant portfolio is a strategic risk mitigation lever.
Liquidity Drawdown as a Function of Asset Diversification
Background
This analysis explores liquidity drawdowns from January 1, 2023, to September 29, 2023, marked by rising crypto asset prices. Using histogram graphs, we specifically examined how open profit and loss (PnL) affected the liquidity available to Liquidity Providers (LPs).
Methodology
Instrument Options for Diversification Analysis
- BTC Only
- BTC and ETH
- A Mix of Cryptocurrencies: BTC, ETH, SOL, BNB, and XRP.
- Crypto and Traditional Assets: BTC, XAU (Gold), and JPY (Japanese Yen).
Assumptions for Simplification
- Equal Open Interest distribution among instruments in each group.
- Consistent Long/Short Open Interest imbalance of 60%/40%.
- Equal average profit or loss for closed winning and losing positions.
- Exclusion of transaction fees and liquidation events.
These assumptions, while simplifying real trading behaviors, help highlight the advantages of diversifying pools with traditional assets.
- BTC vs. BTC and ETH
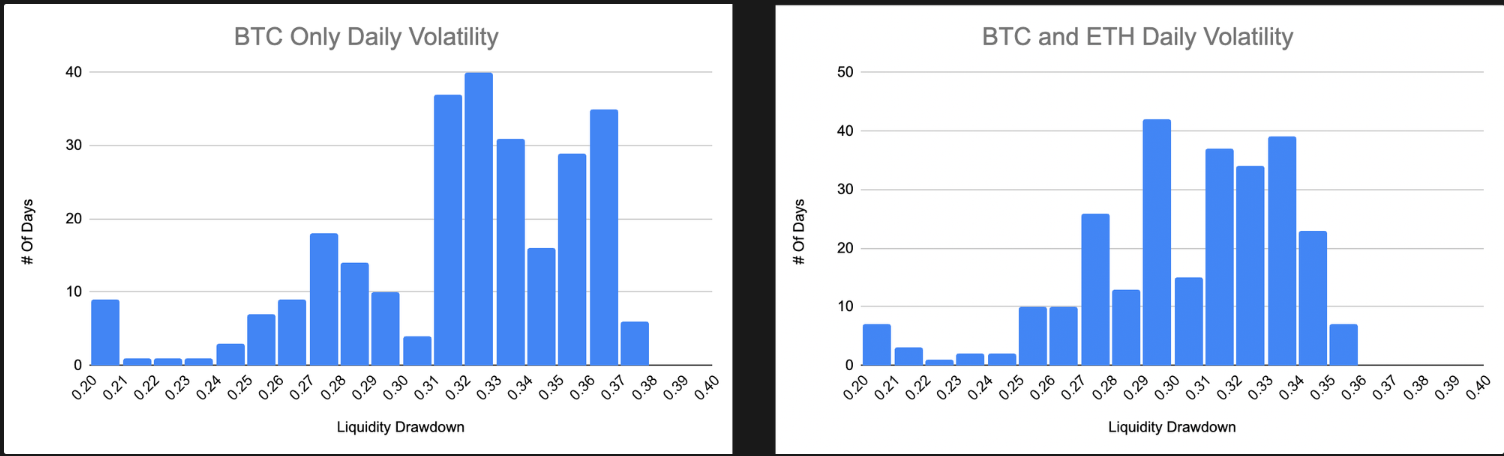
- A minor decrease in pool asset volatility from an average drawdown of 31.87% to 30.44%.
- Demonstrates a stabilizing effect on liquidity by adding ETH to the trading pair.
2. BTC vs. BTC, ETH, SOL, BNB, and XRP
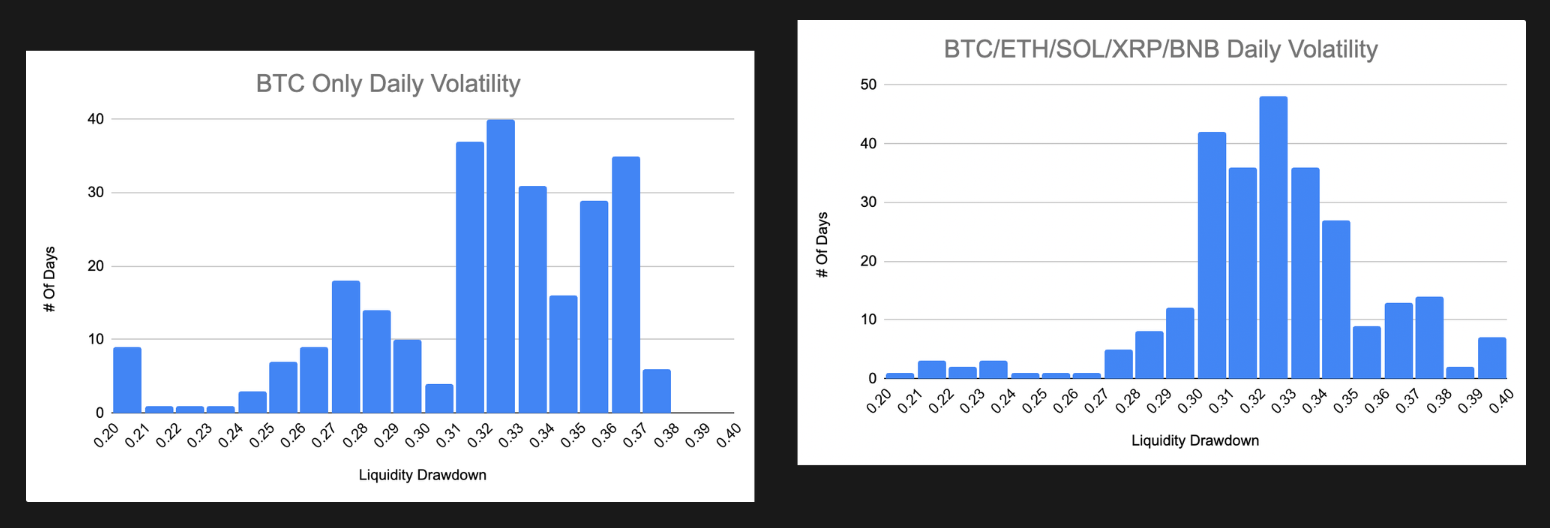
- Increase in pool liquidity volatility, showcasing an average drawdown of 32.42%.
- Highlights the challenges of managing a diversified crypto-asset basket.
3. BTC vs. BTC, XAU, JPY
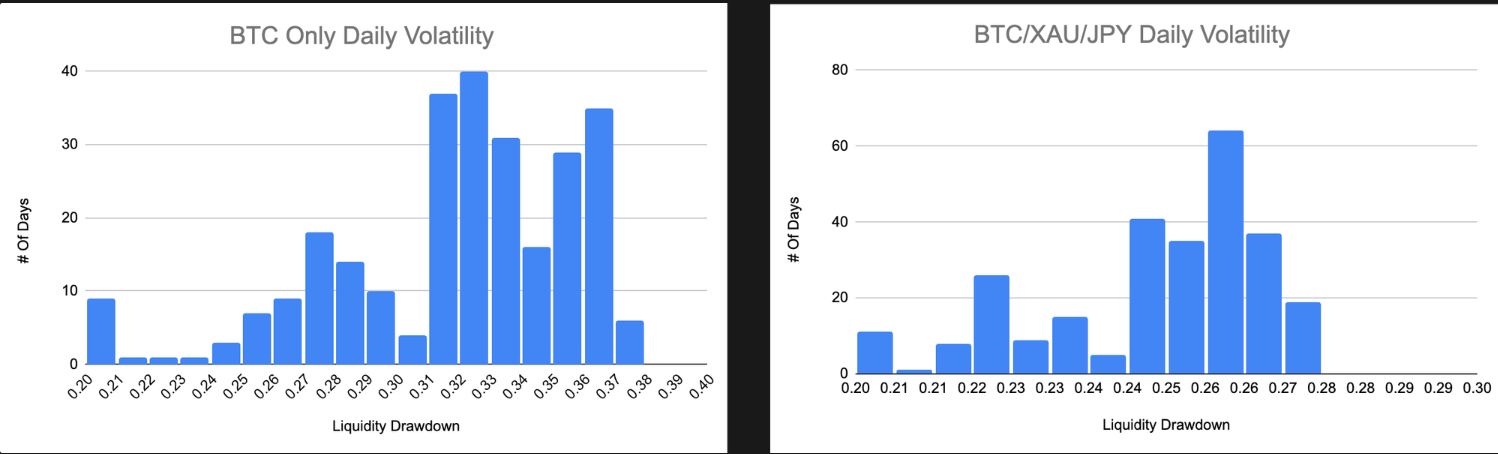
- Substantial reduction in pool liquidity volatility to 24.82% average drawdown.
- Emphasizes the effectiveness of diversifying with traditional assets like gold (XAU) and Japanese yen (JPY).
Insights
The study reveals the complex effects of asset diversification on liquidity in perpetual DEX environments. While merely combining various crypto assets doesn't always yield greater stability, including traditional assets like gold and fiat currencies can effectively dampen volatility. This insight is precious for market participants and liquidity providers in the evolving DeFi space, emphasizing the importance of strategic asset combinations to manage risk and stabilize liquidity.
Summary
This research article, developed in collaboration with the Ostium team, focuses on asset diversification via RWA's contribution to single-pool multi-asset portfolios. We explored Ostium’s Imbalance Score for measuring pool imbalances. This metric extends the scope of Modern Portfolio Theory’s Portfolio Return Variance.
We undertook a detailed analysis combining historical data with simulations of various portfolio states. This approach enabled us to evaluate the impact of incorporating less-correlated RWAs into multi-asset pools. The results are precise: integrating RWAs reduces Imbalance Score mean and variances.
It is essential to acknowledge the inherent risks of trading on decentralized exchanges. While our strategy of diversifying with RWAs addresses certain risks, others are out of the scope of this article. Our ongoing collaboration with the Ostium team is dedicated to exploring and developing additional risk mitigation strategies and methodologies. This future research will further our commitment to enhancing the safety, stability, and efficiency of DEX trading, contributing to the evolution of secure and robust blockchain-based financial systems.
What’s Next
While sharing similarities with traditional finance, the risk management landscape in cryptocurrency presents unique challenges. These include the asynchronous nature of transaction execution, innovative mechanism designs, extreme volatility, high composability, and interdependencies at the code level. Additionally, the crypto market often experiences intense fluctuations in liquidity, setting it apart from traditional financial markets.
A critical factor in crypto risk management has been the tight correlations between asset classes. Historically, these correlations have acted as catalysts for cascading liquidations during market downturns. However, the potential to decouple these correlations is emerging as a promising avenue for enhancing capital efficiency. It could also lead to more relaxed and innovative risk management methodologies.
With Ostium, we're poised to delve deeper into this realm. Breaking down traditional correlation barriers will unlock new market efficiency and risk control levels.
In our forthcoming articles, we'll shed light on our unique approach to risk management, tailored explicitly for RWA-Focused Perpetual Exchange platforms.
Oracle Risk and Security Standards: An Introduction (Pt. 1)
Chaos Labs is open-sourcing our Oracle Risk and Security Standards Framework to improve industry-wide risk and security posture and reduce protocol attacks and failures. Our Oracle Framework is the inspiration for our Oracle Risk and Security Platform. It was developed as part of our work leading, assessing, and auditing Oracles for top DeFi protocols.
sBNB Oracle Exploit Post Mortem
Chaos Labs summarizes the snBNB oracle exploit affecting the Venus LST Isolated Pool. The post-mortem focuses on the event analysis and risk management efforts following the exploit.
Risk Less.
Know More.
Get updates on our research, product, and launch.