dYdX Chain Analytics and Risk Monitoring Portal
Overview
Chaos Labs is thrilled to introduce the dYdX Chain Analytics and Risk Monitoring Portal, a significant development in our continued partnership with the dYdX community. This portal encompasses the emerging dYdX Chain, providing valuable insights and risk assessment capabilities. Additionally, it features a dynamic leaderboard that offers real-time tracking and visibility into traders' points, providing transparency and clarity regarding their positions in the Launch Incentives Program.
What is the dYdX Chain?
Elevating the Decentralized Trading Experience
The dYdX Chain represents a significant leap in the evolution of decentralized trading platforms. Transitioning from a Layer 2 solution on Ethereum, it morphs into an independent blockchain within the Cosmos ecosystem. This version introduces a fully decentralized framework, by operating on its own chain with dedicated validators. In addition, open-sourcing the dYdX Chain code enhances transparency and fosters community engagement in protocol development. This rollout signifies a commitment to full decentralization and aims to offer unparalleled transaction speeds, setting a new standard in DeFi efficiency and scalability.
dYdX Chain Risk Hub: Platform Deep Dive
Chaos Labs' Risk Hub for the dYdX Chain integrates seamlessly with the protocol, providing a comprehensive view of the market dynamics and risk factors.
Overview
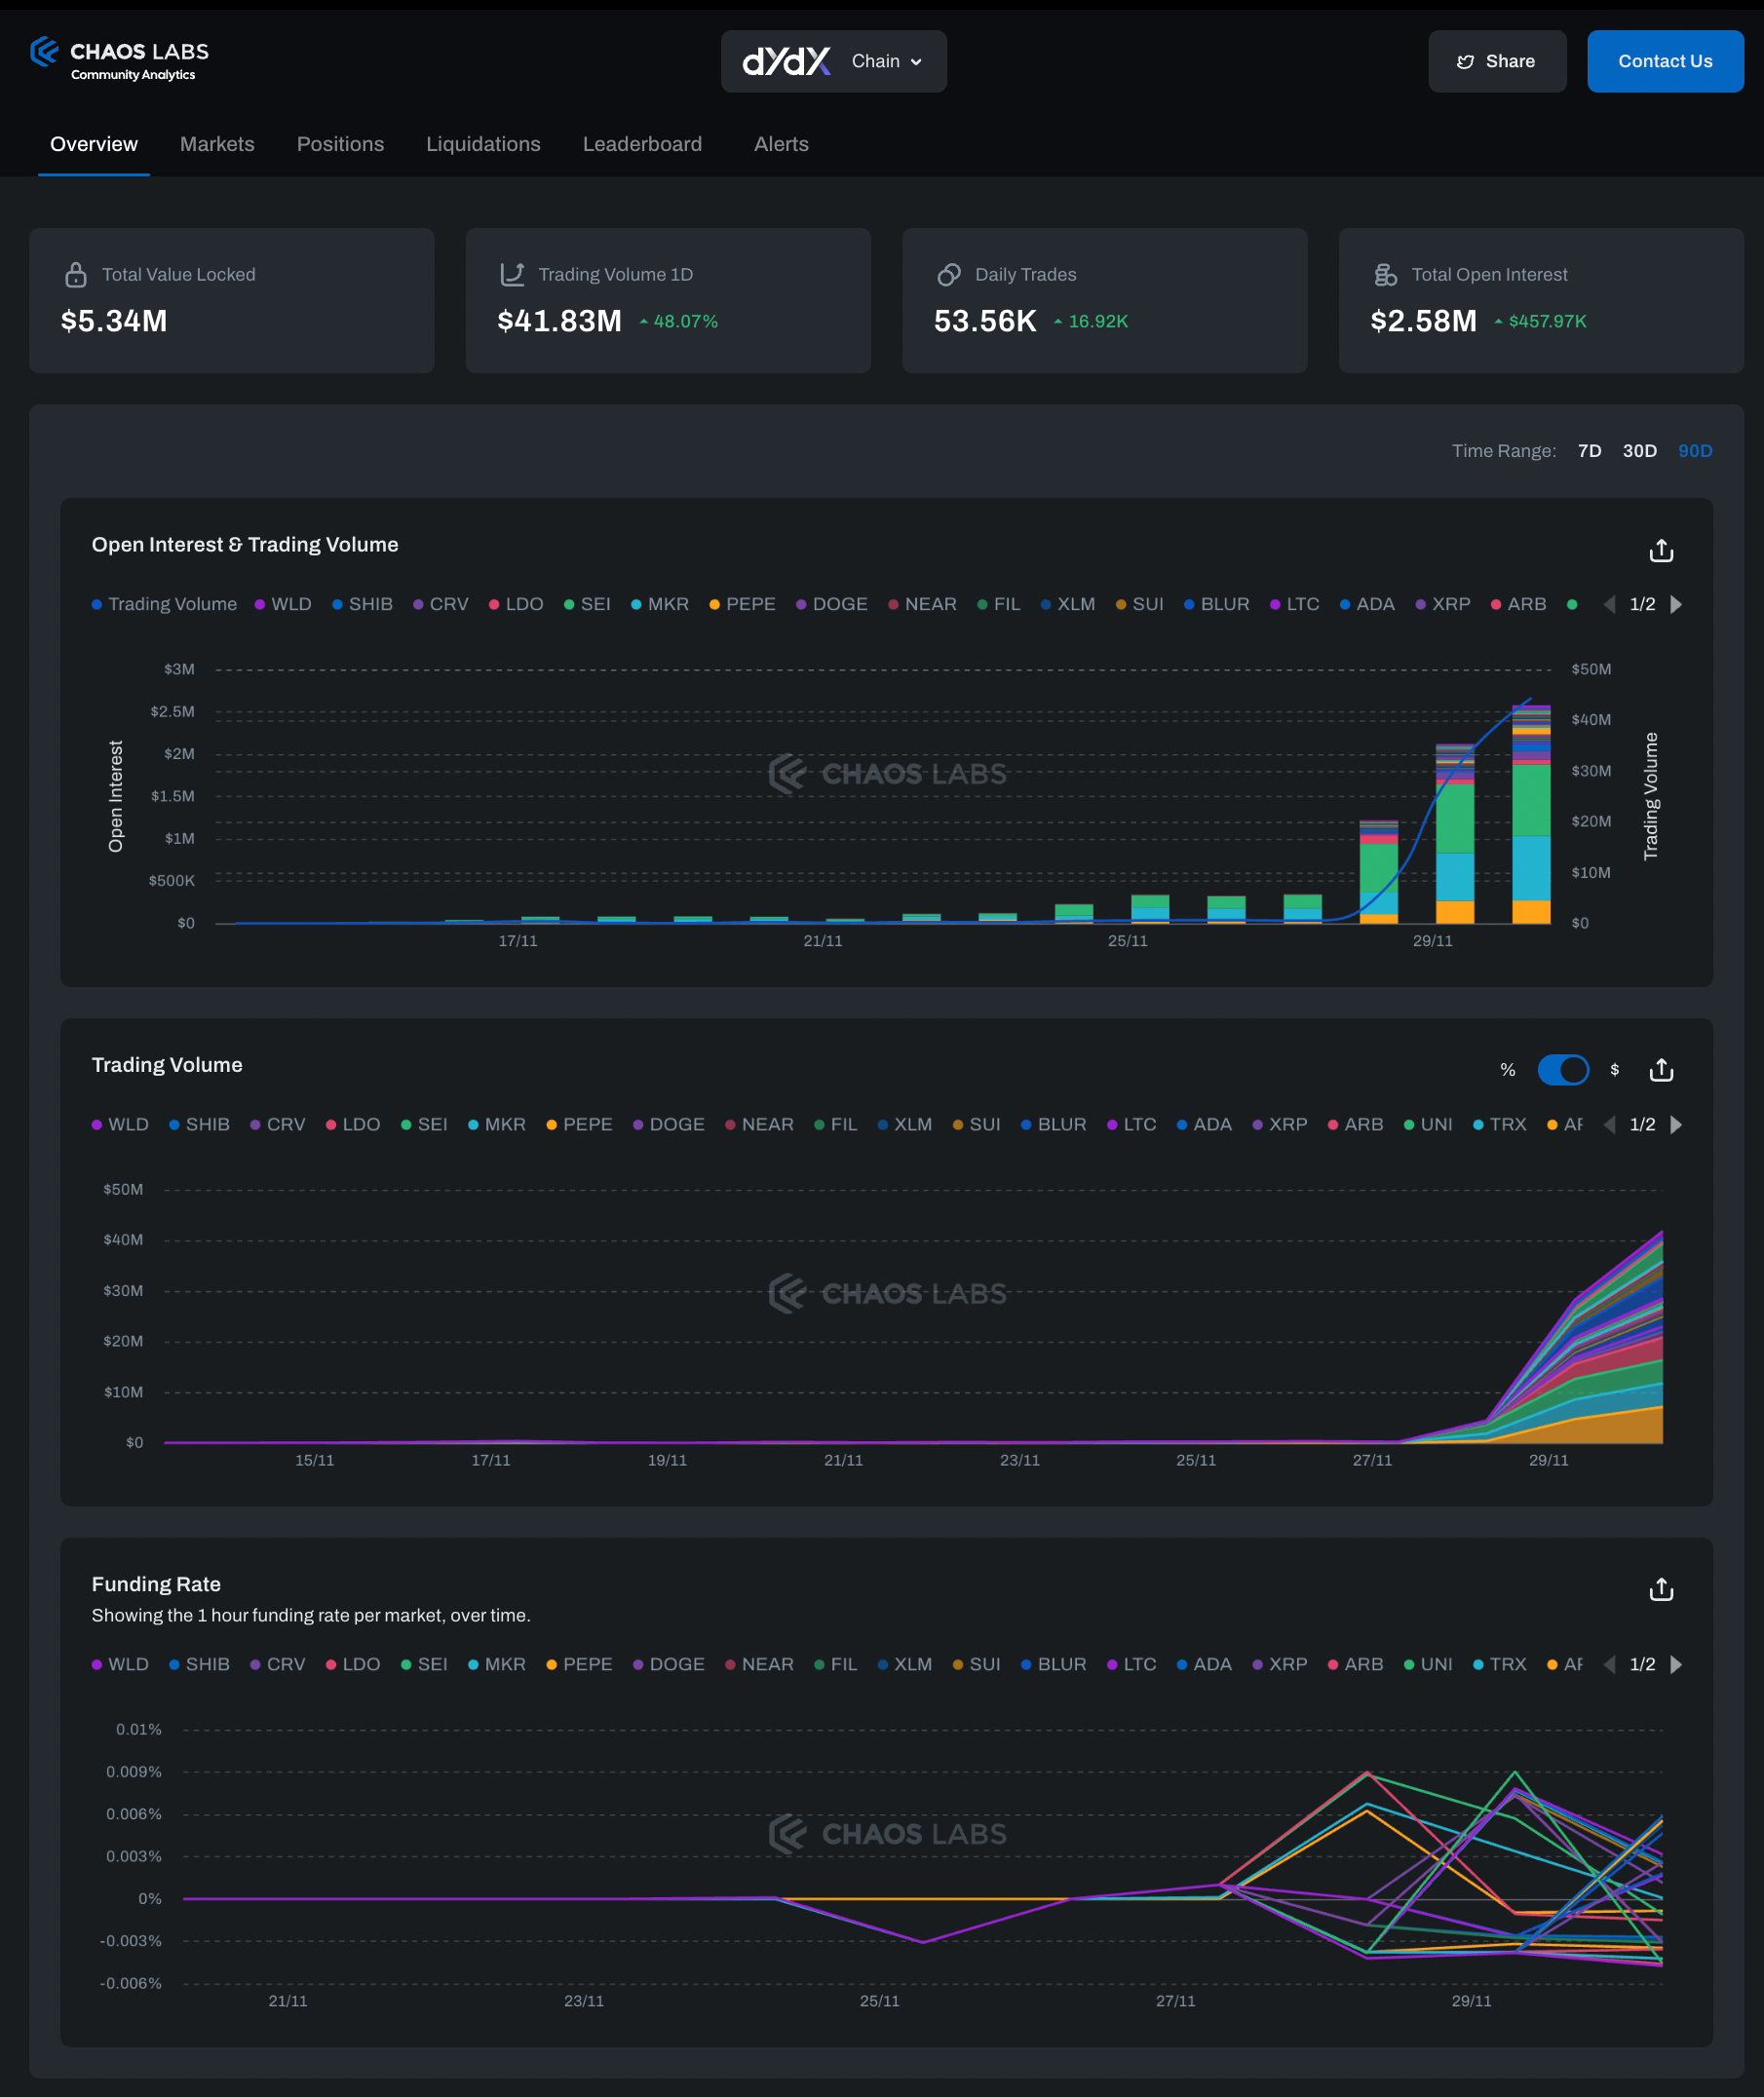
The Overview section of the Risk Hub offers a high-level perspective of the dYdX Chain across all markets and accounts, including trading volume, number of trades, open interest, and funding rates. This dashboard provides insights into aggregated metrics and time series data, helping users identify trends and anomalies in market behavior.
Markets
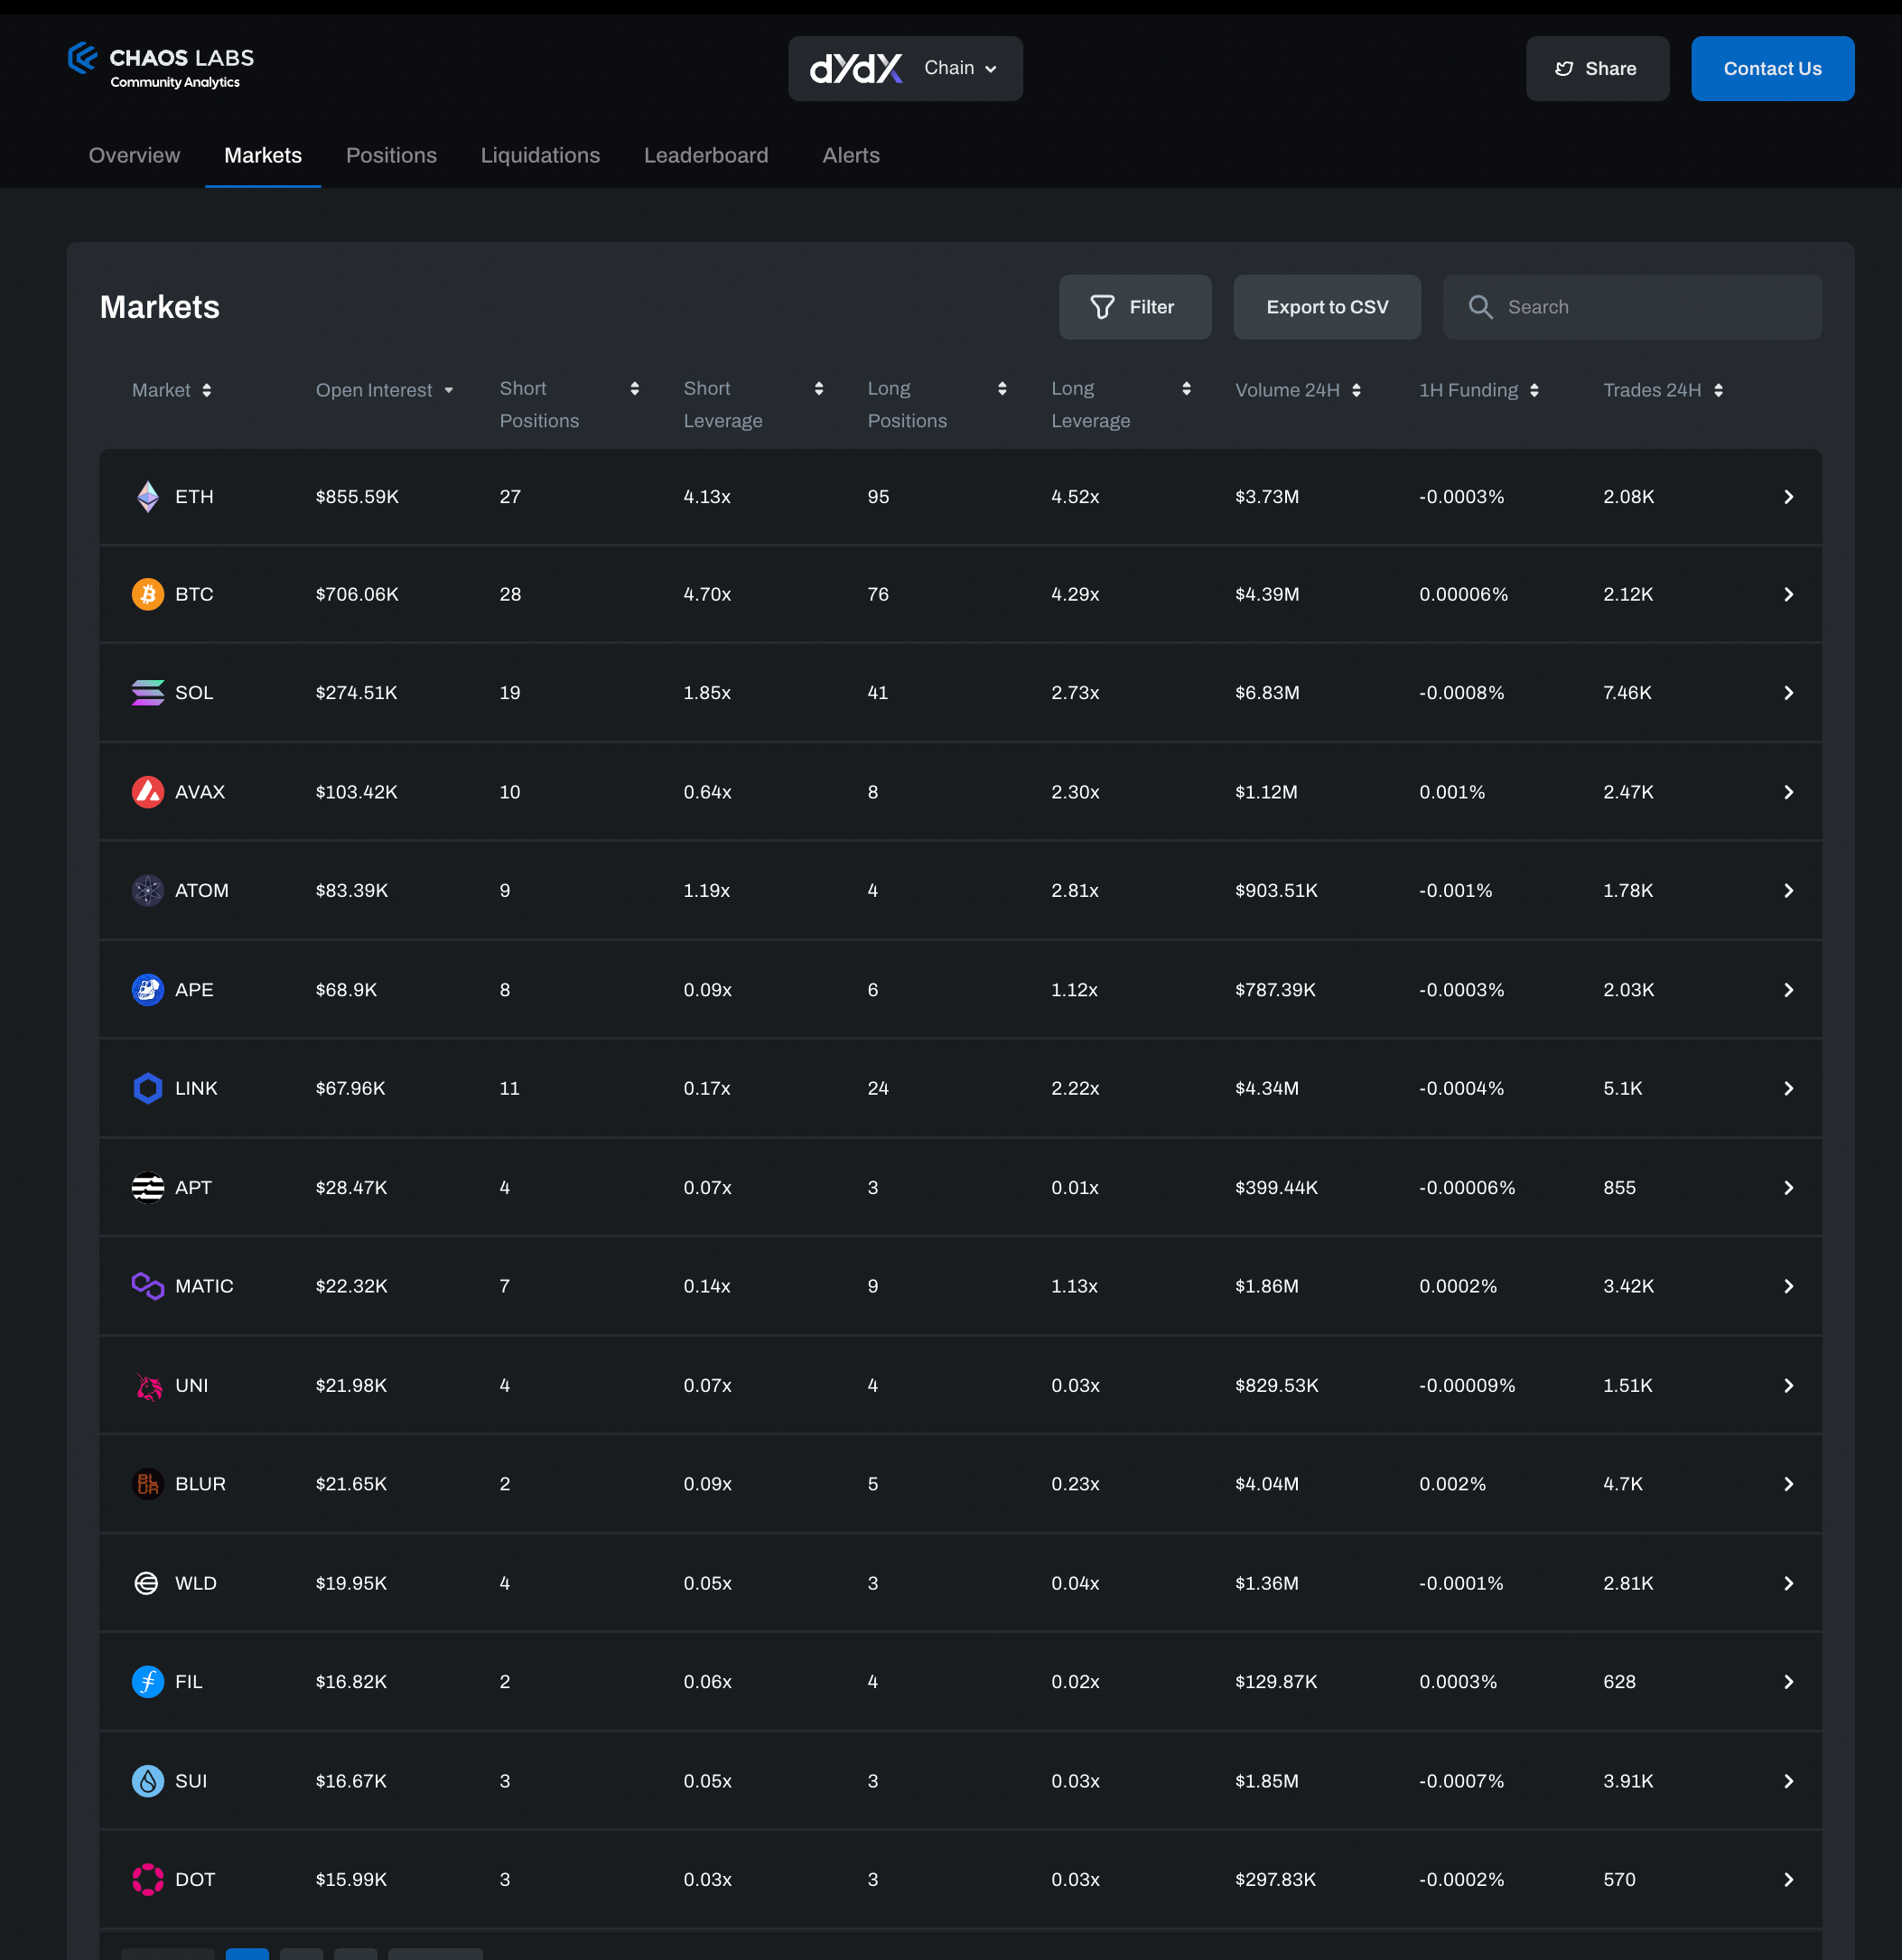
The Markets tab presents a detailed view of all markets on the dYdX Chain, including critical data such as open interest, and the average leverage used in short and long positions. This section provides users with a broad perspective of market activities and dynamics.
Market Detail
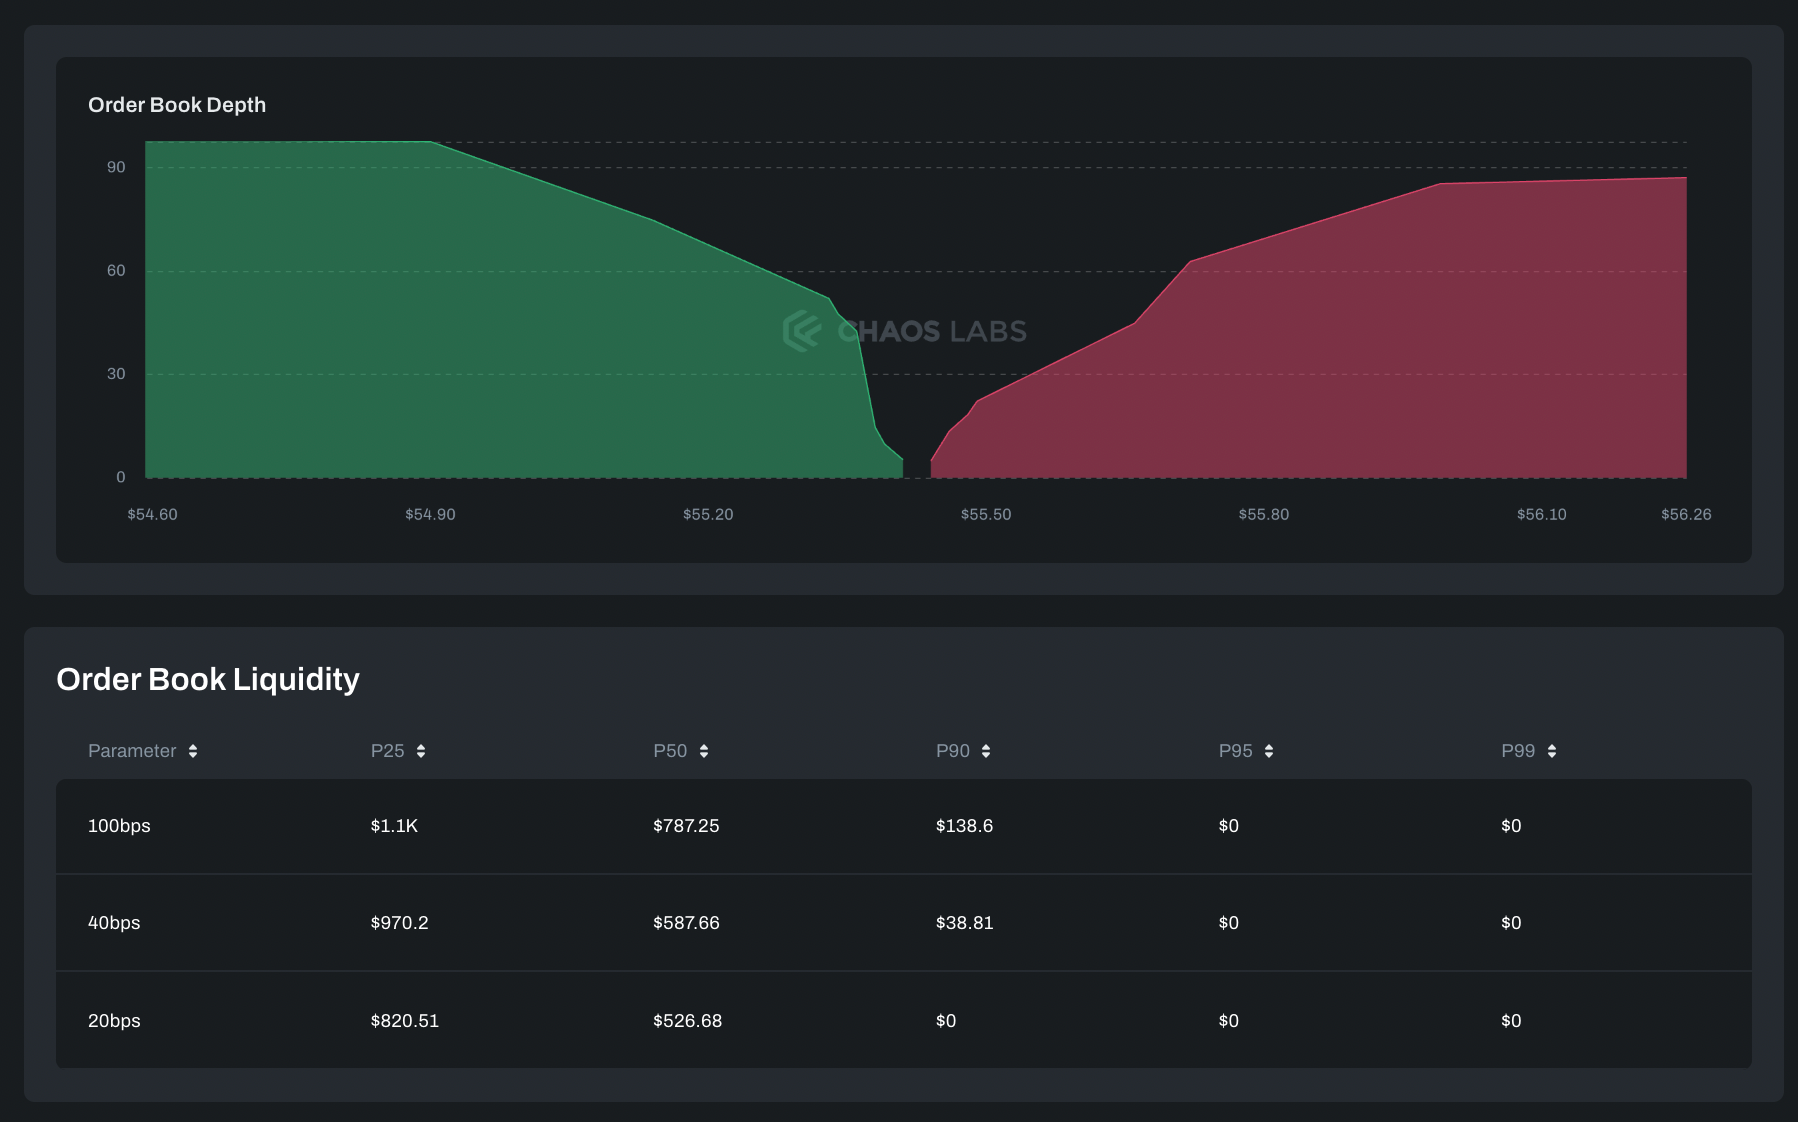
Selecting a market leads to a more detailed analytics page, offering insights into the order book liquidity and market funding rate. Time series data for asset prices and open interest are also available for in-depth market analysis.
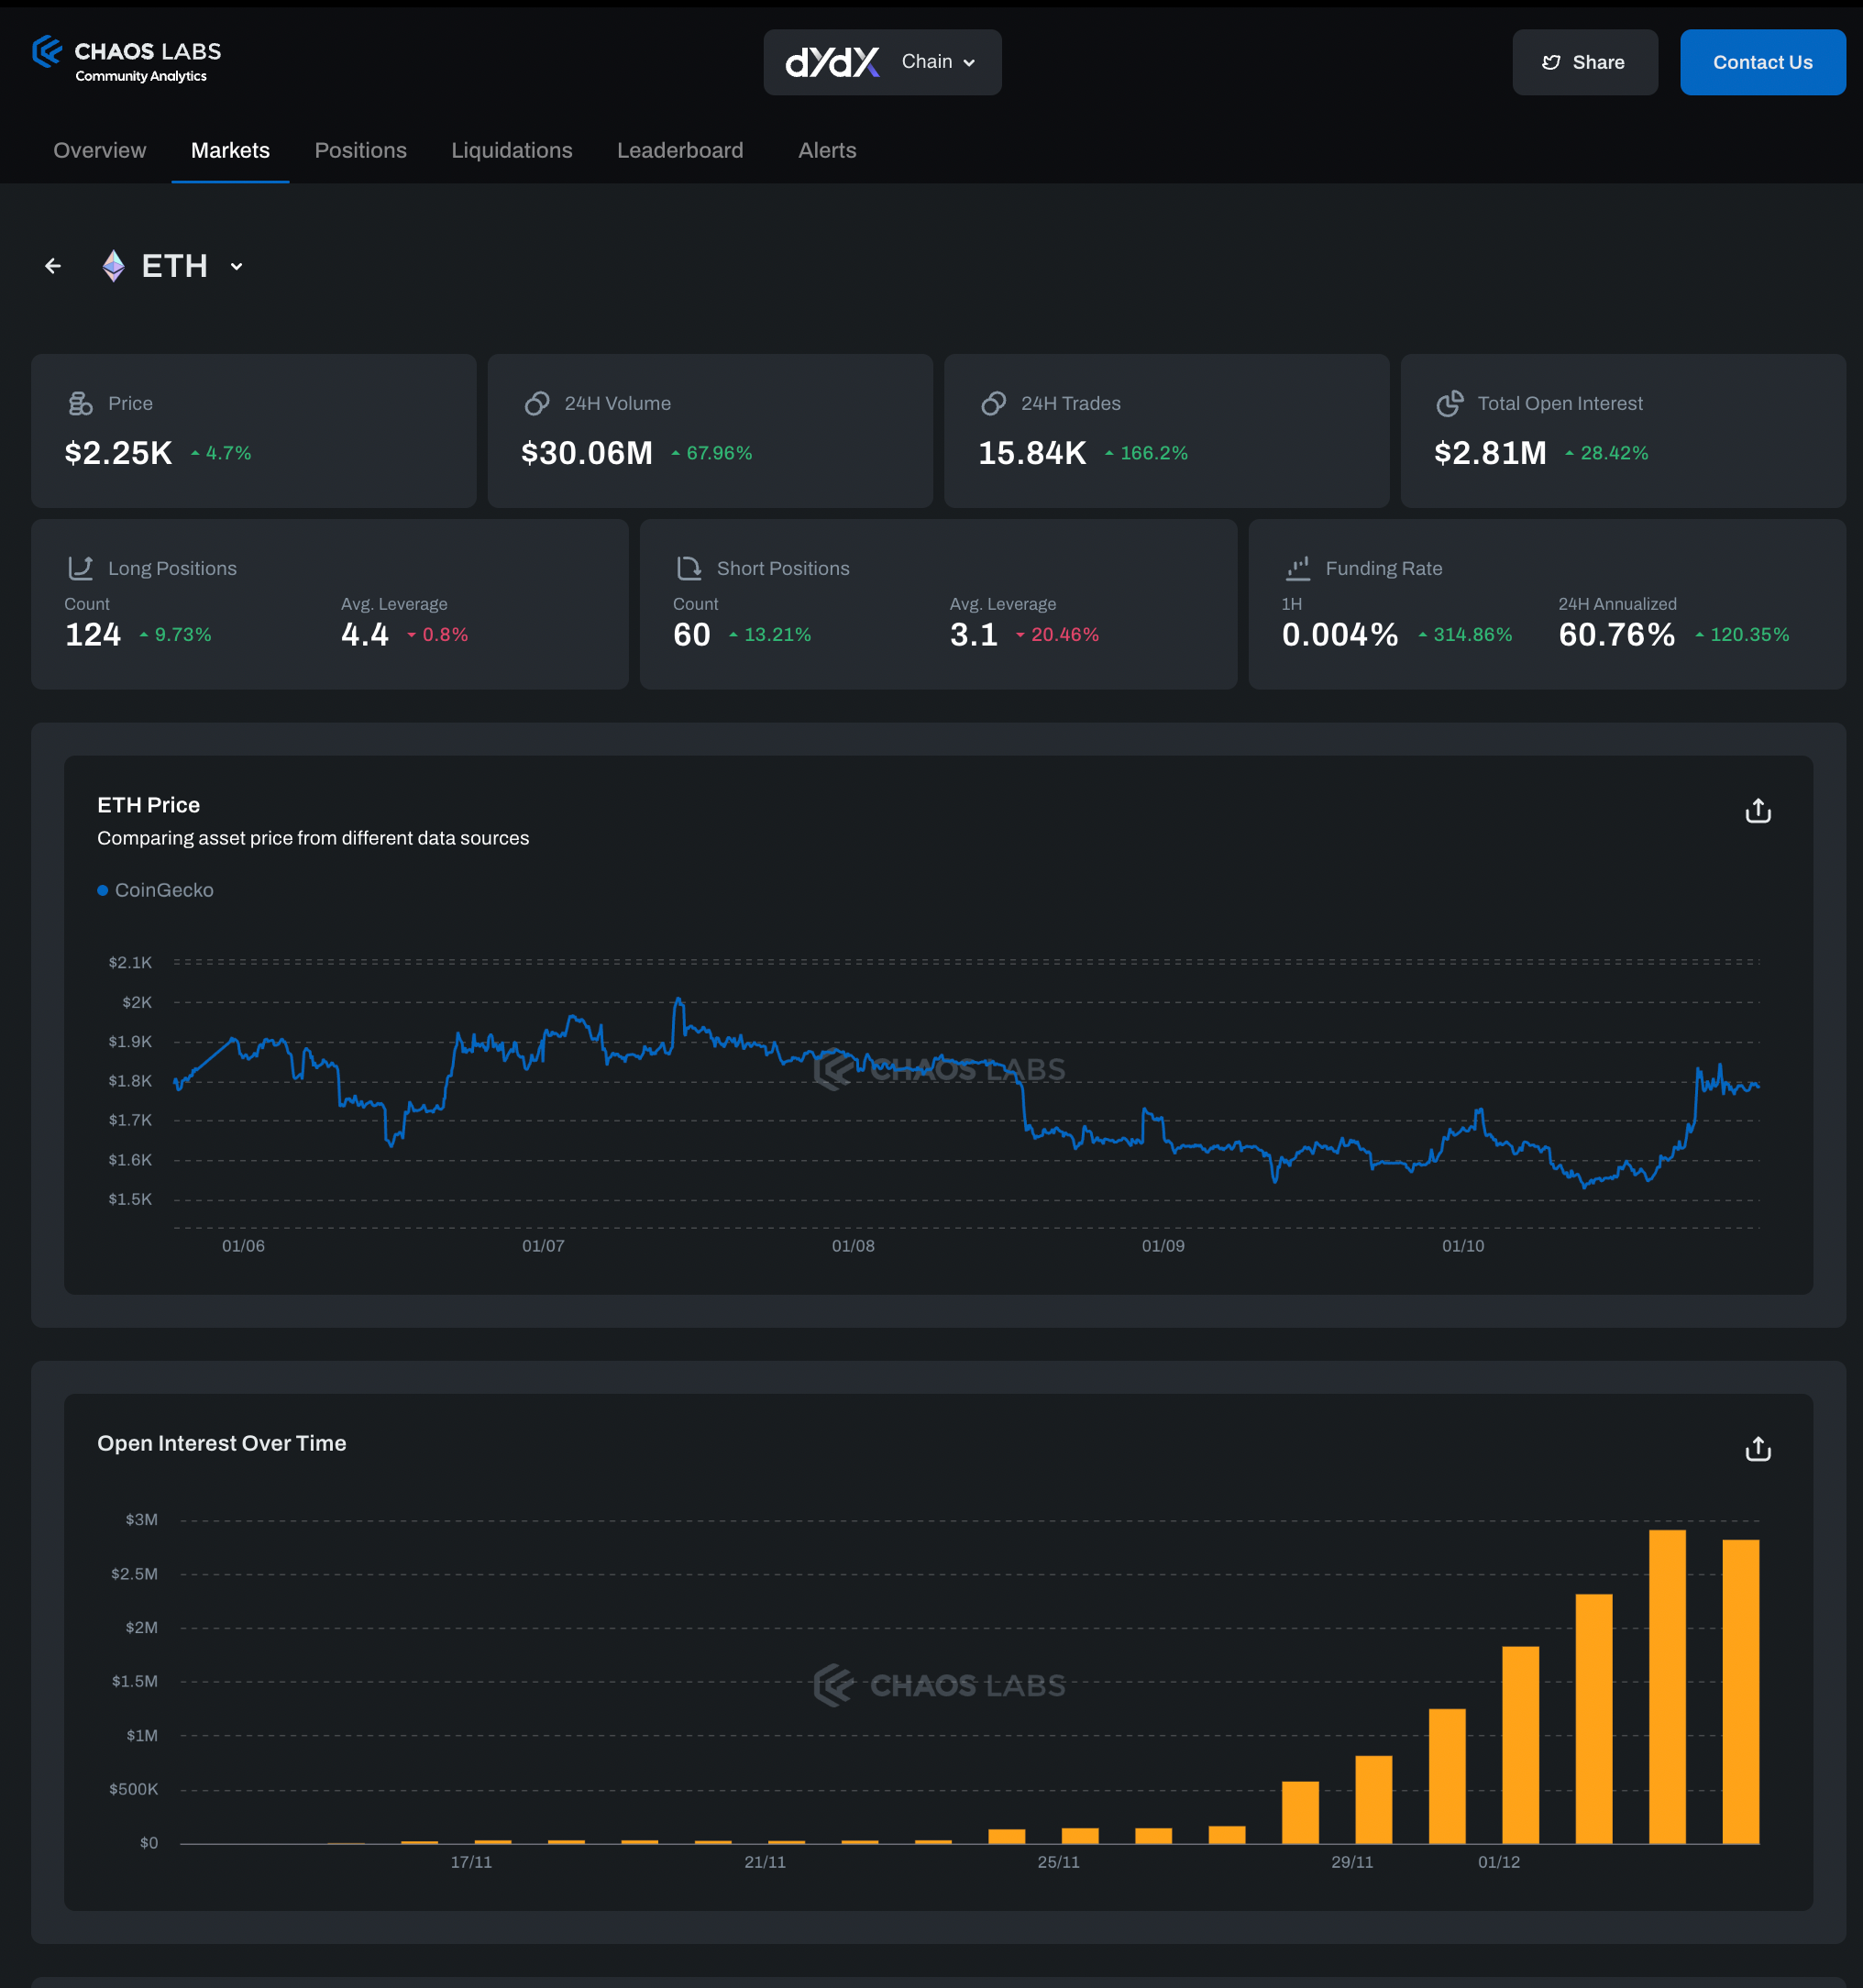
The Positions section within the market page lists all currently open positions within that market.
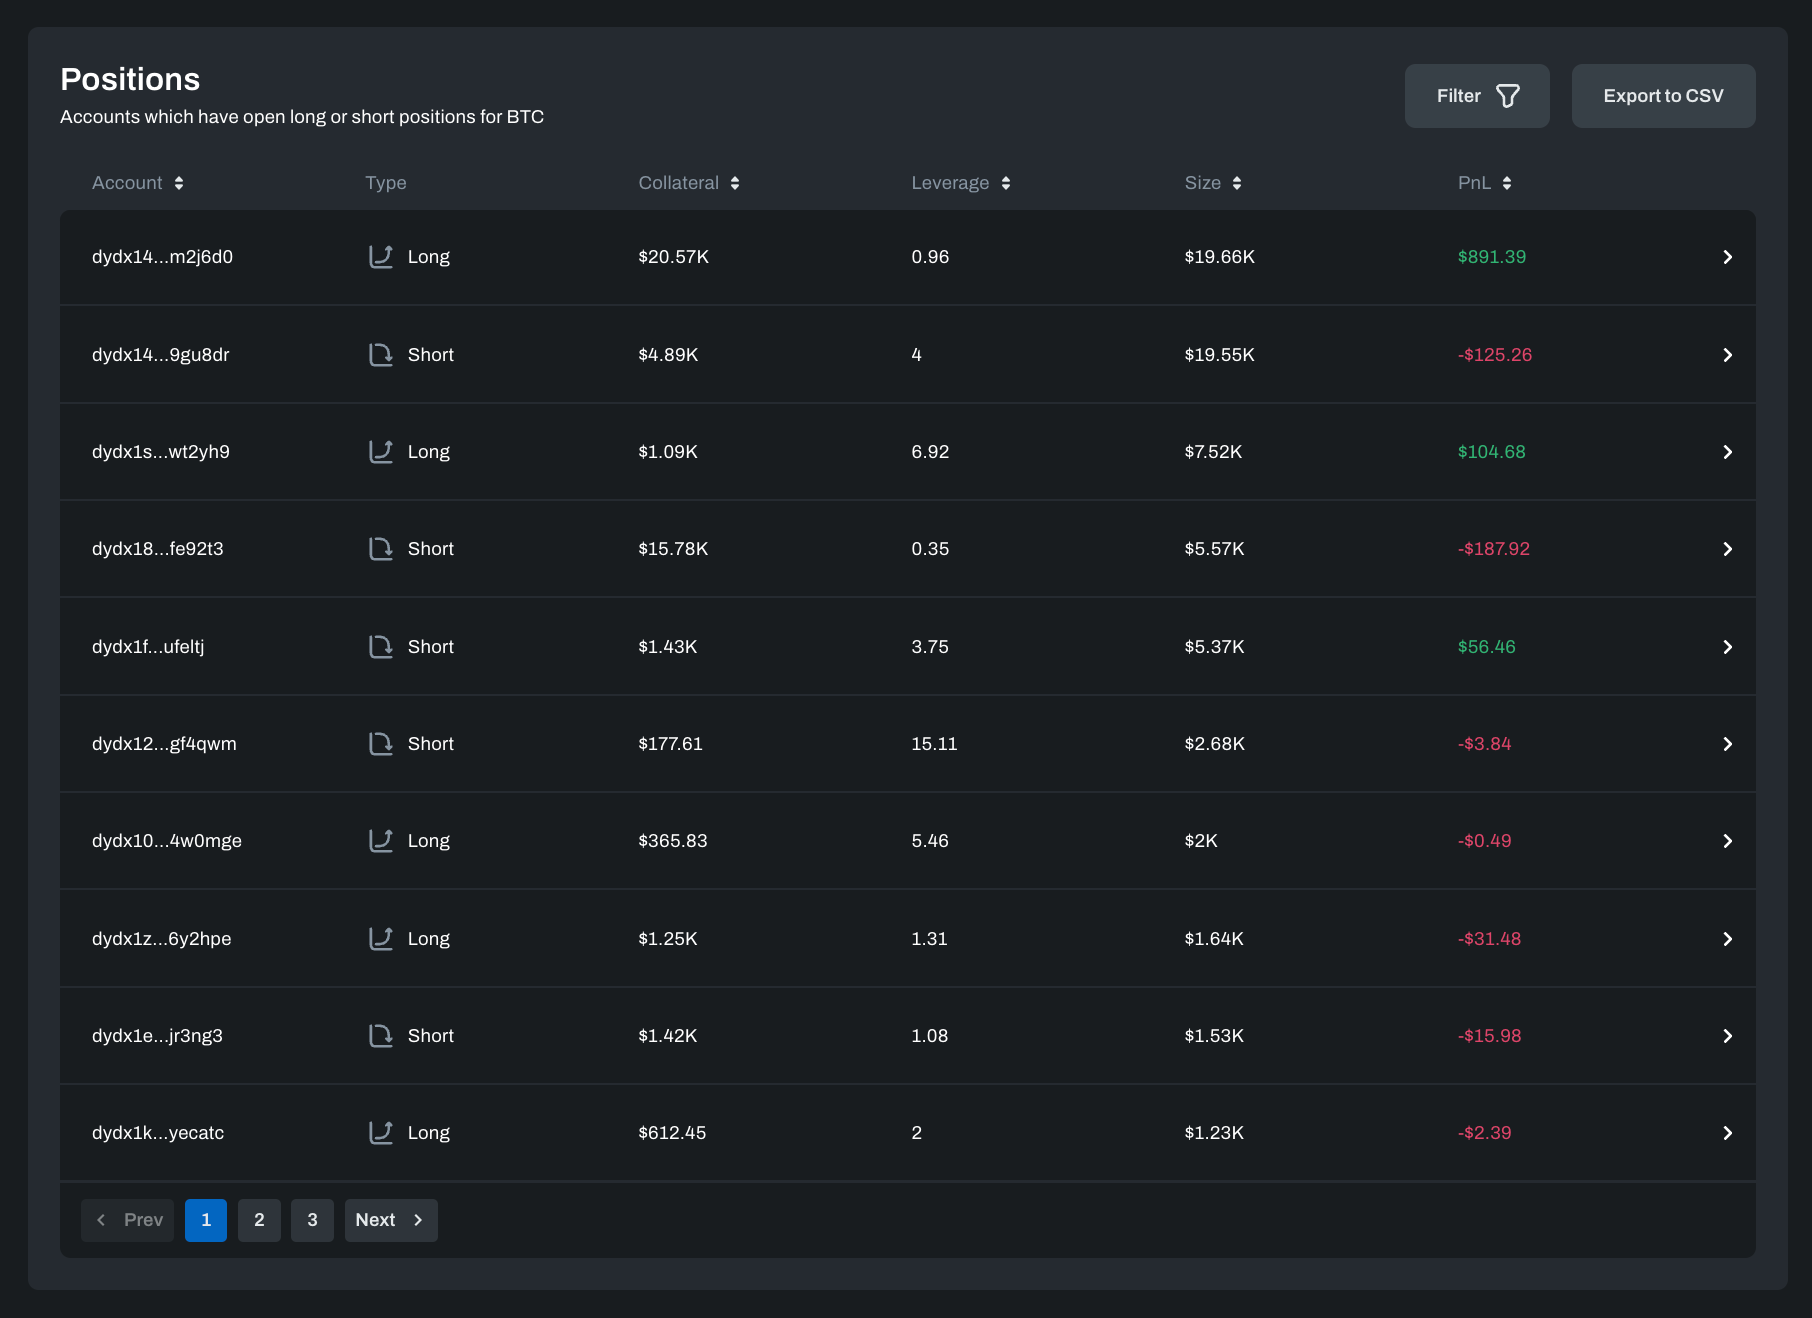
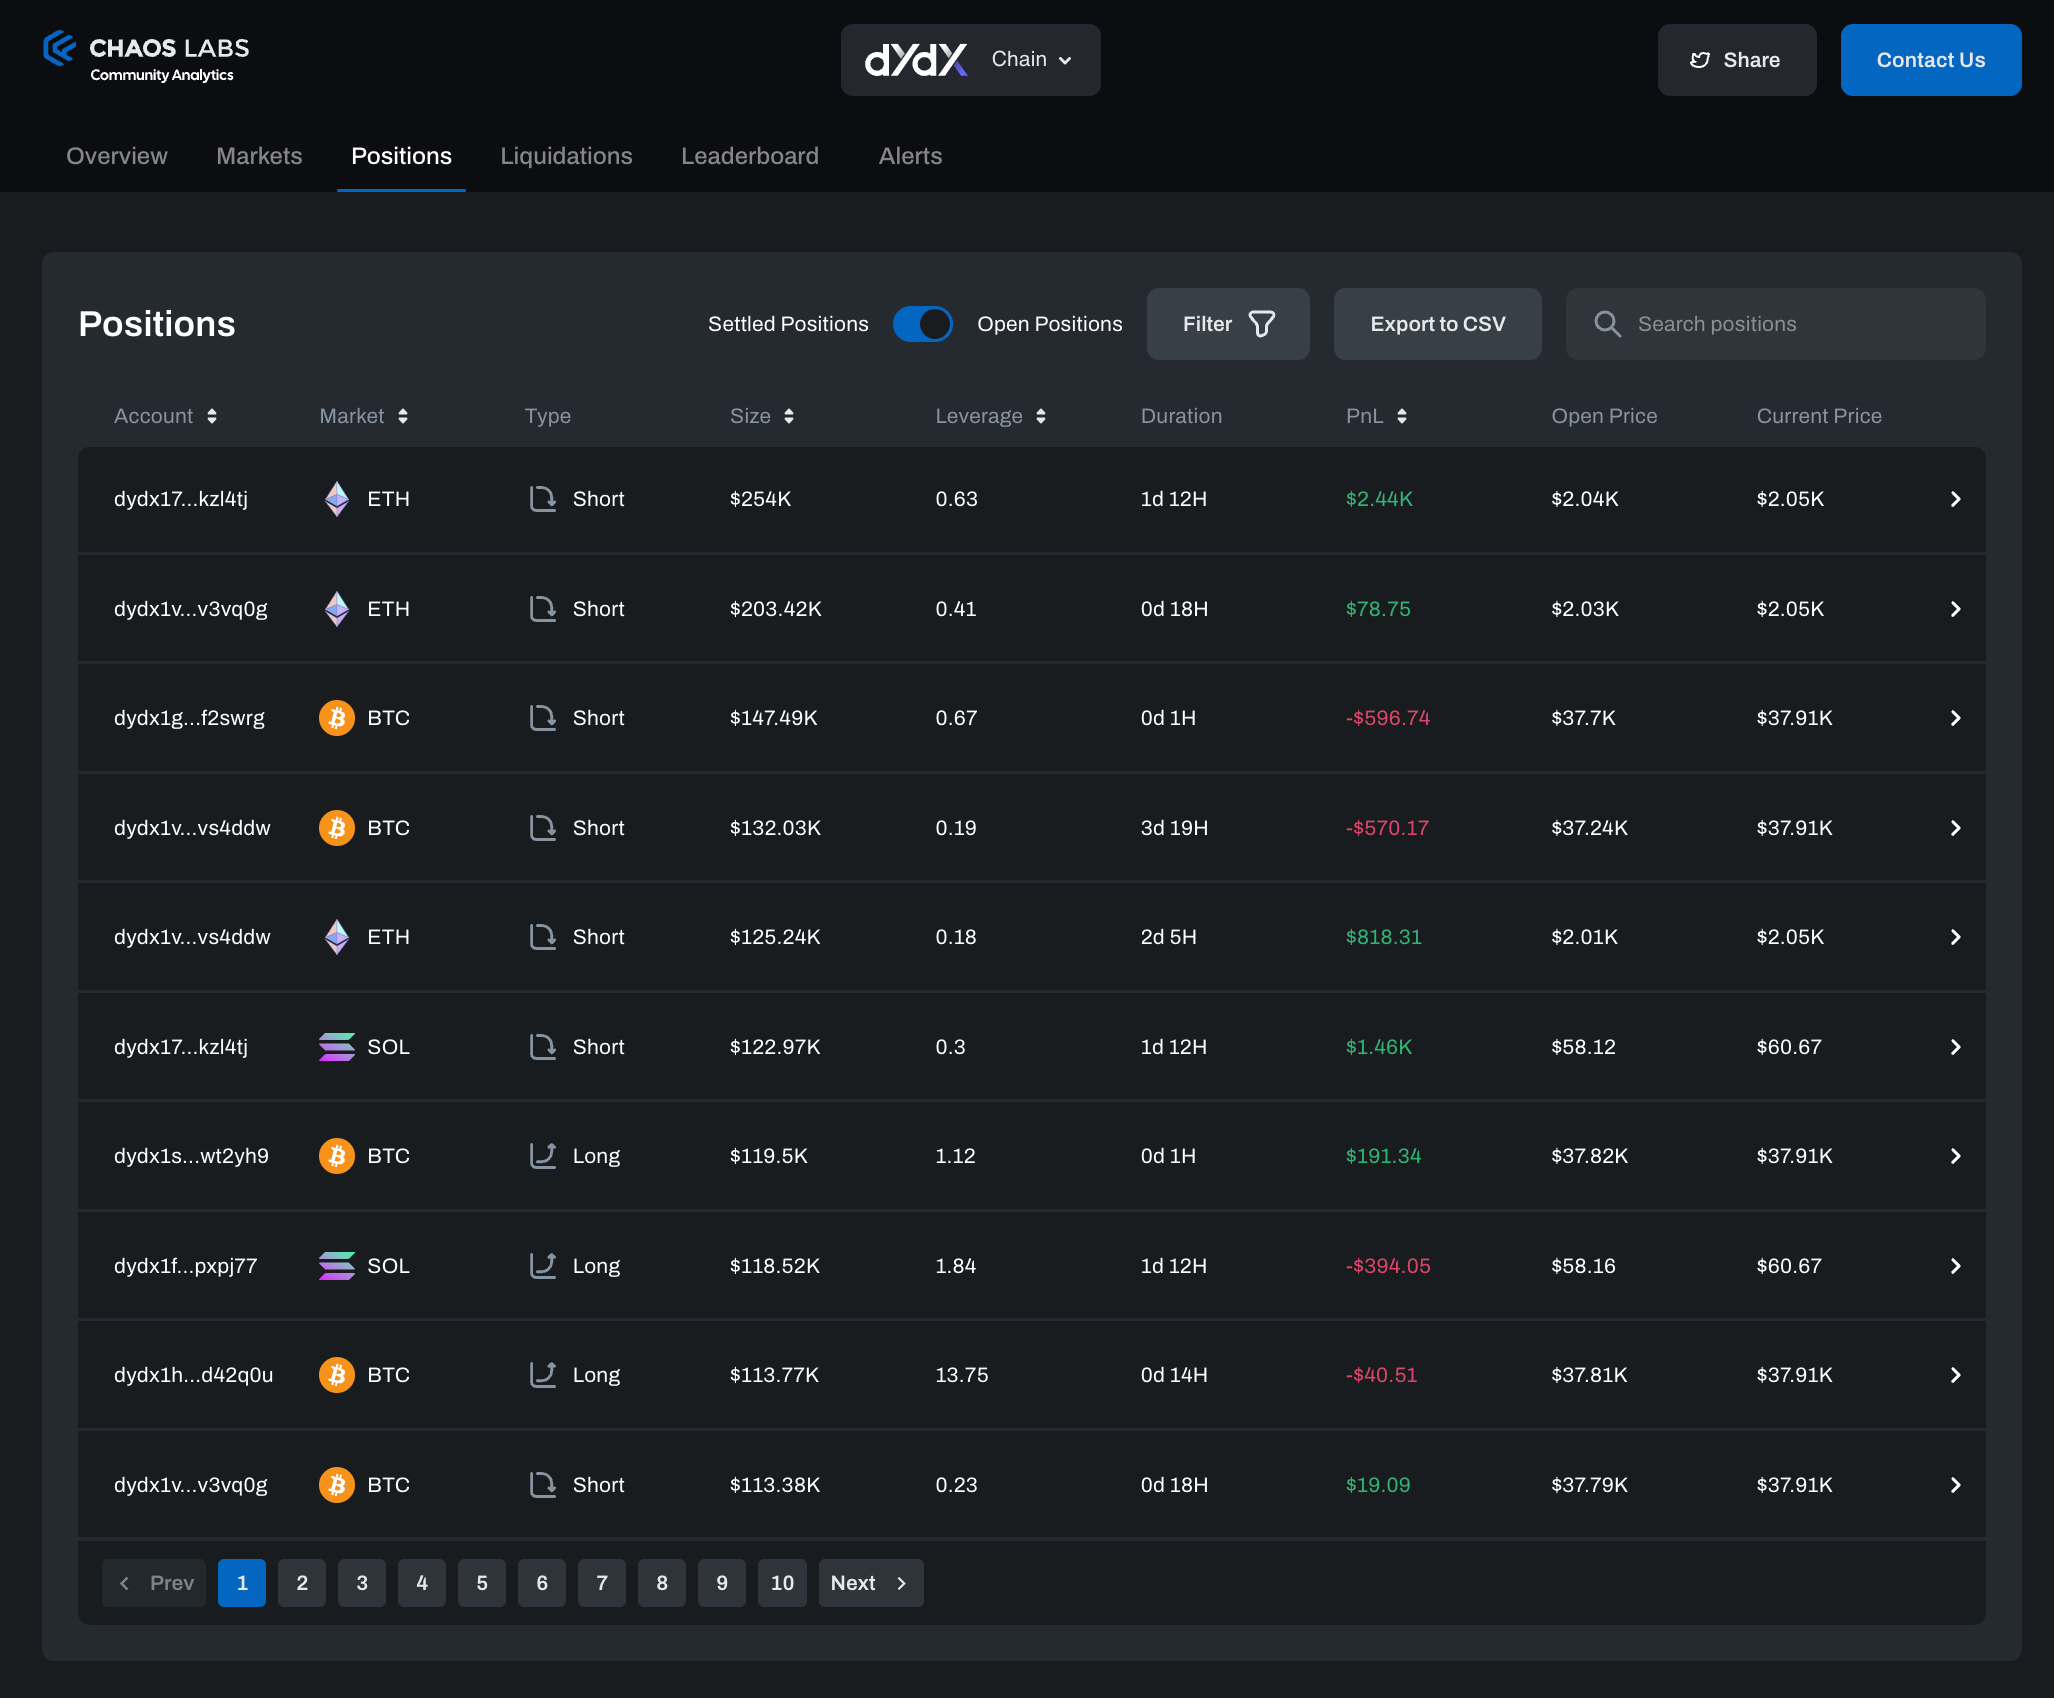
Positions
The Positions page acts as a comprehensive search engine for all positions on the dYdX Chain, encompassing both open and settled positions. Users can filter positions by various criteria, including asset, profit and loss, leverage, and position type.
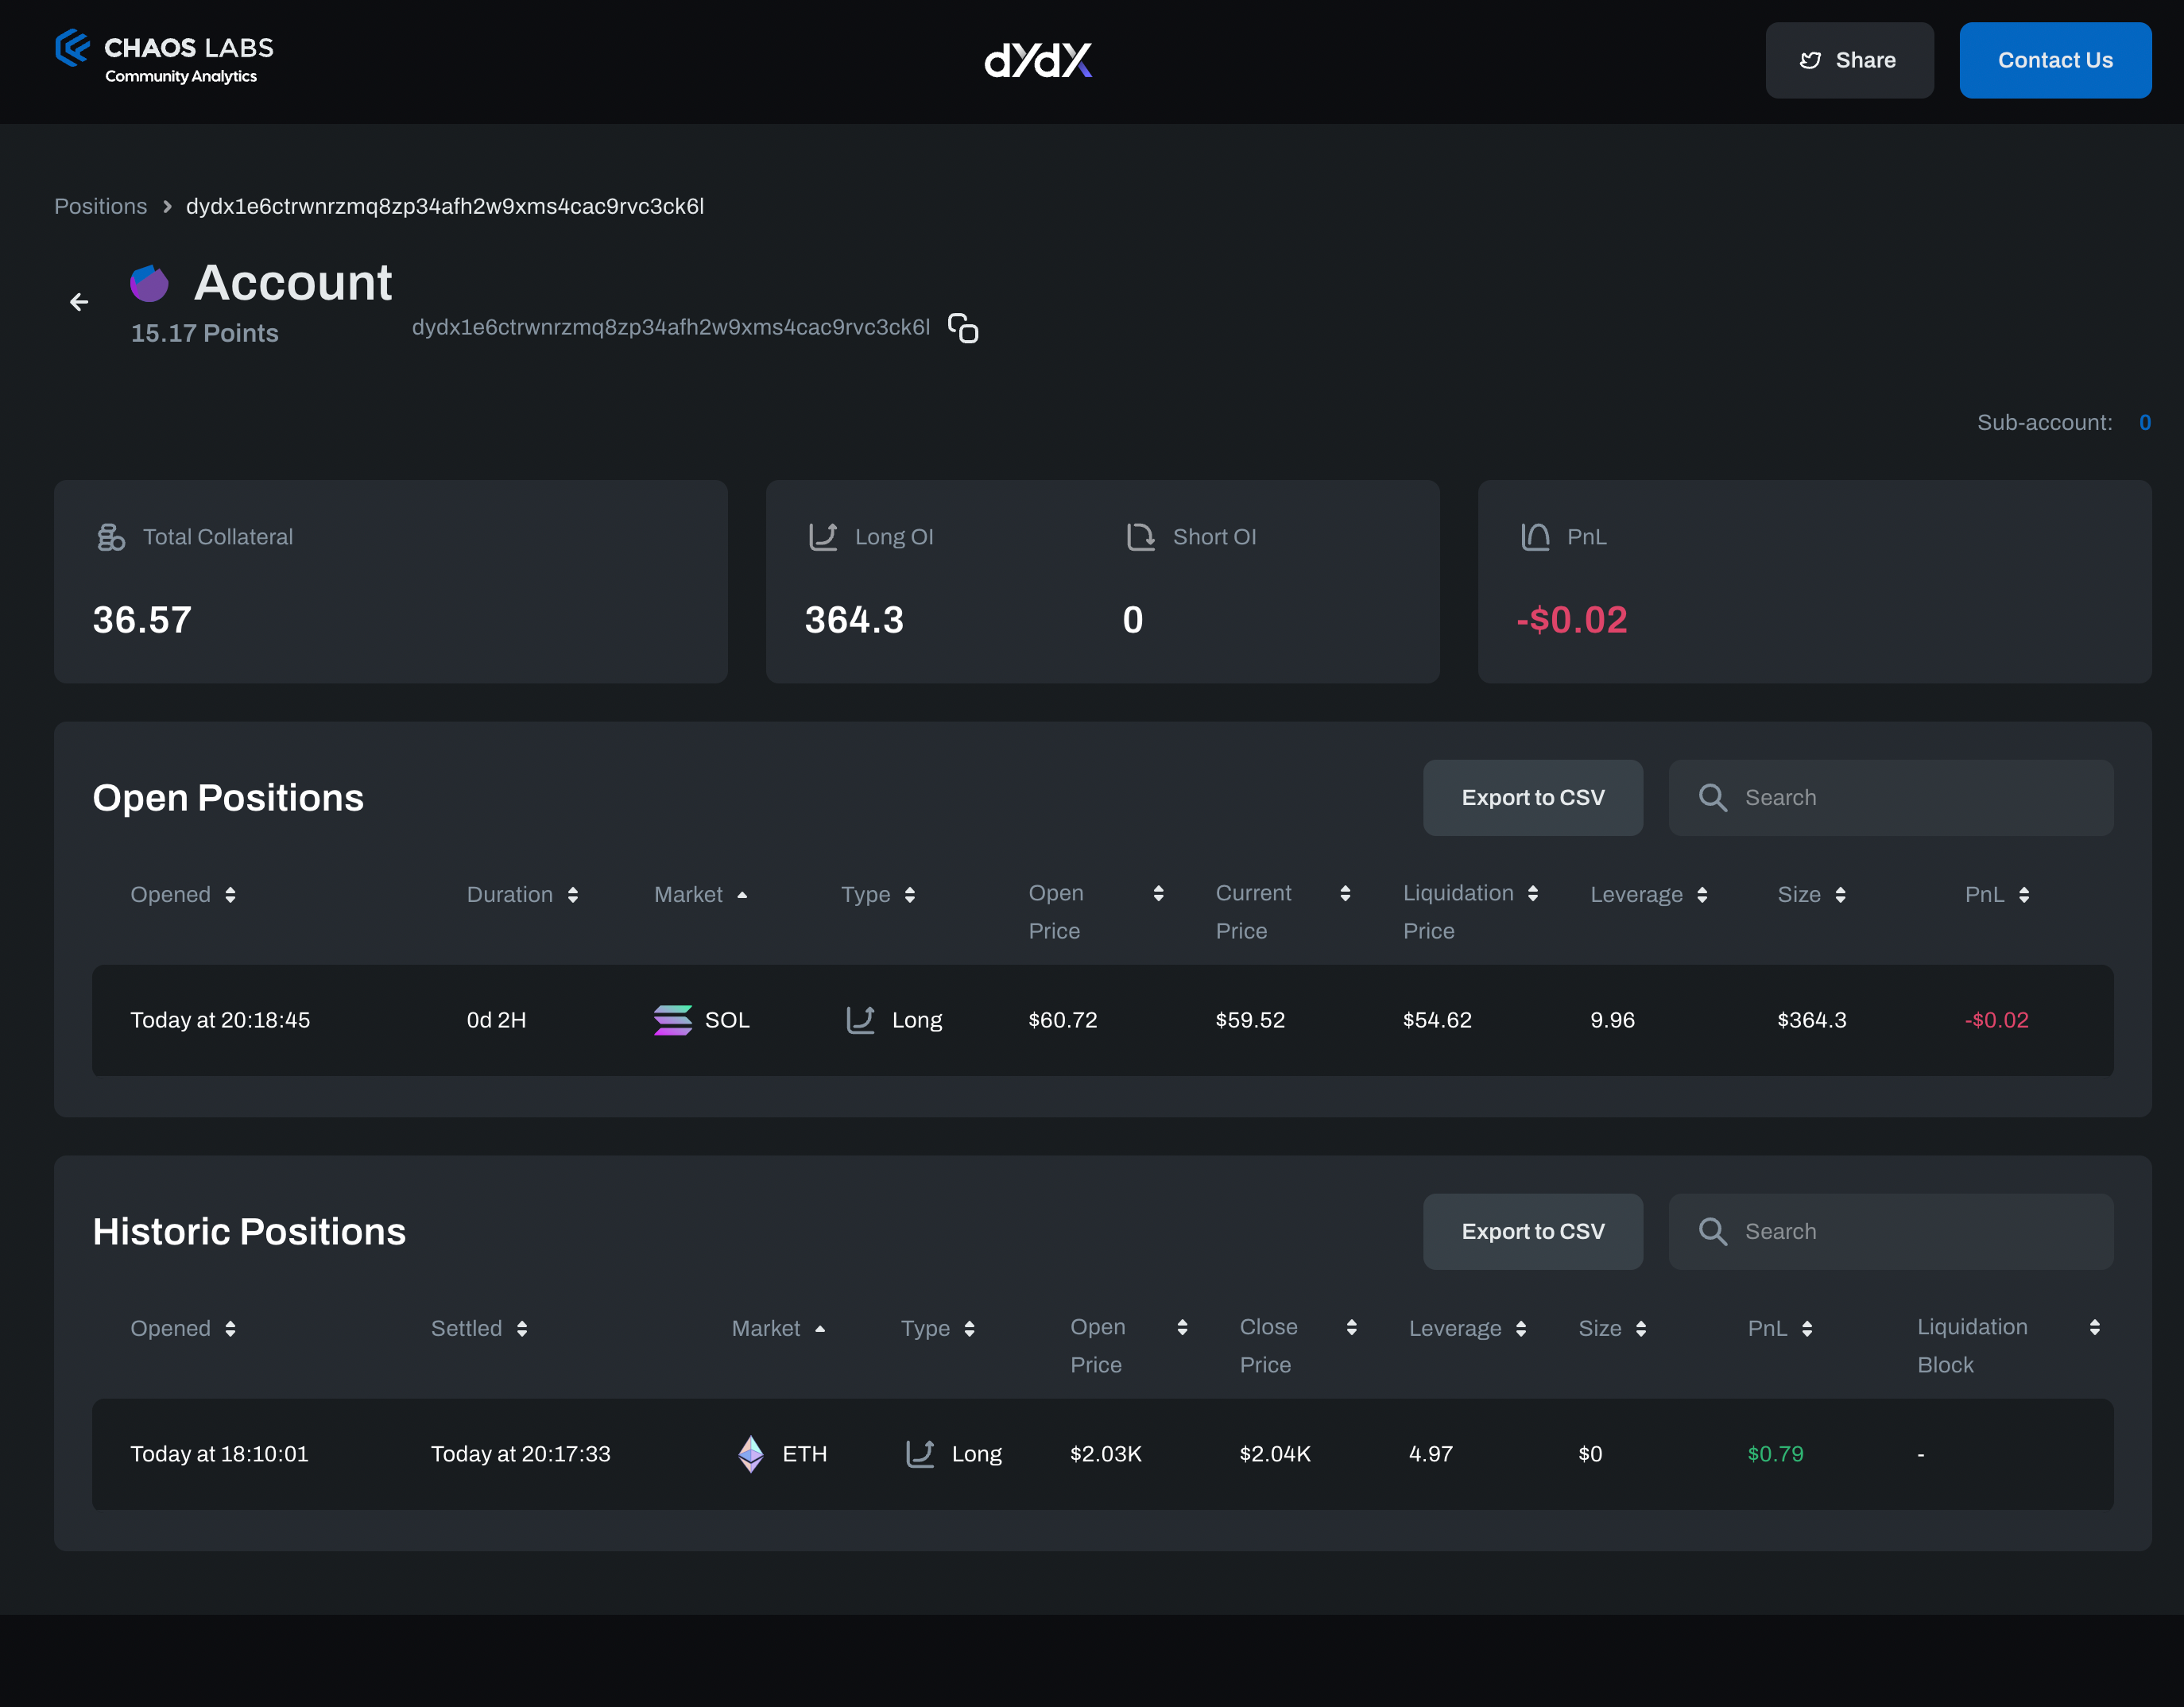
Account Details
Accessing an account's detail page provides a comprehensive snapshot, showcasing both active and settled positions linked to that account. Recognizing the complexity of trading strategies, dYdX supports the creation of multiple subaccounts under a single main account, allowing trades to be compartmentalized. If there are several subaccounts, the interface conveniently provides a switch to navigate between them seamlessly. This design is tailored to give users an in-depth view of their trading activities, making it easier to evaluate and refine their trading approaches.
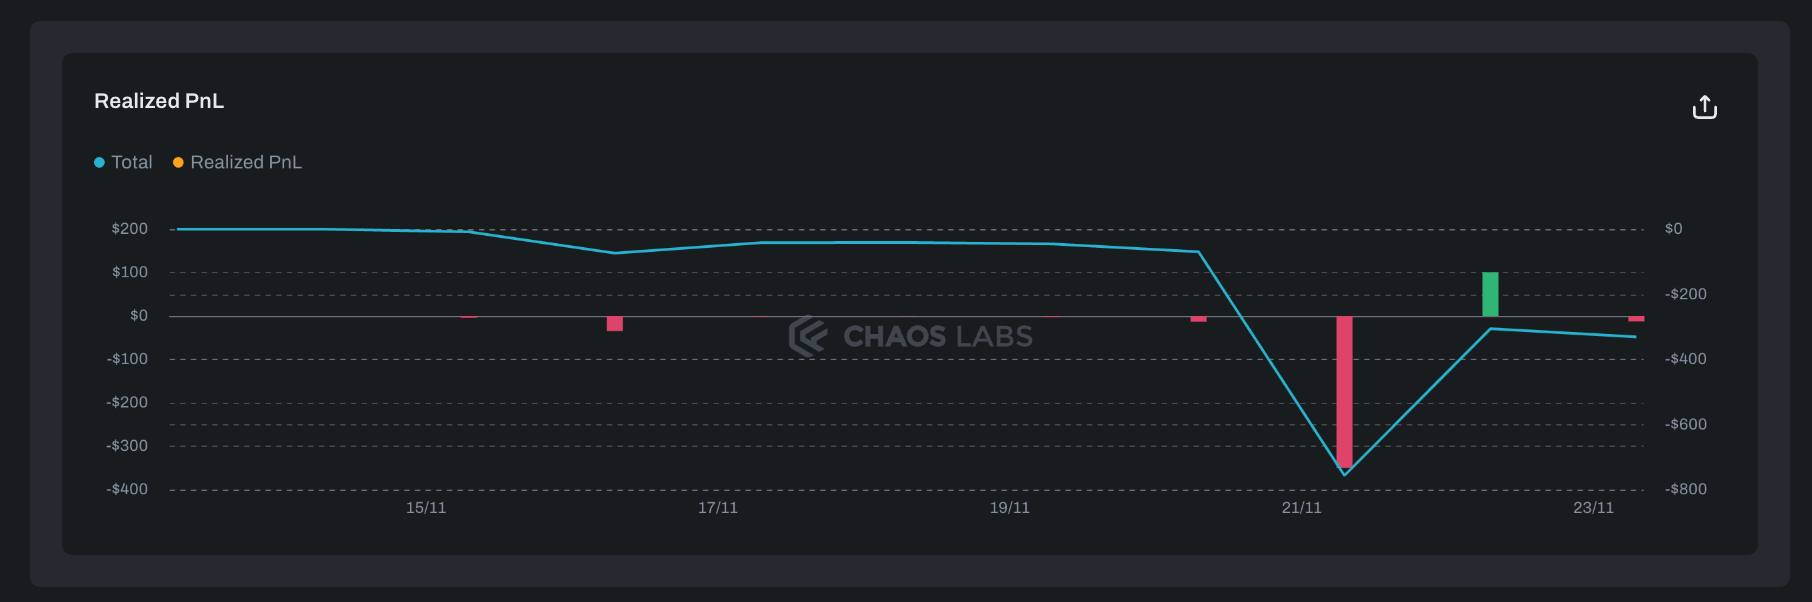
The Account Details page also includes information about the Launch Incentives Program Reward Points earned by the trader. Reward Points represent the amount of trader activity on the dYdX platform, and are distributed in 4 trading seasons, each 4-6 weeks long. Launch Incentives are paid to traders by the end of each trading season based on the amount of points gained during the season.
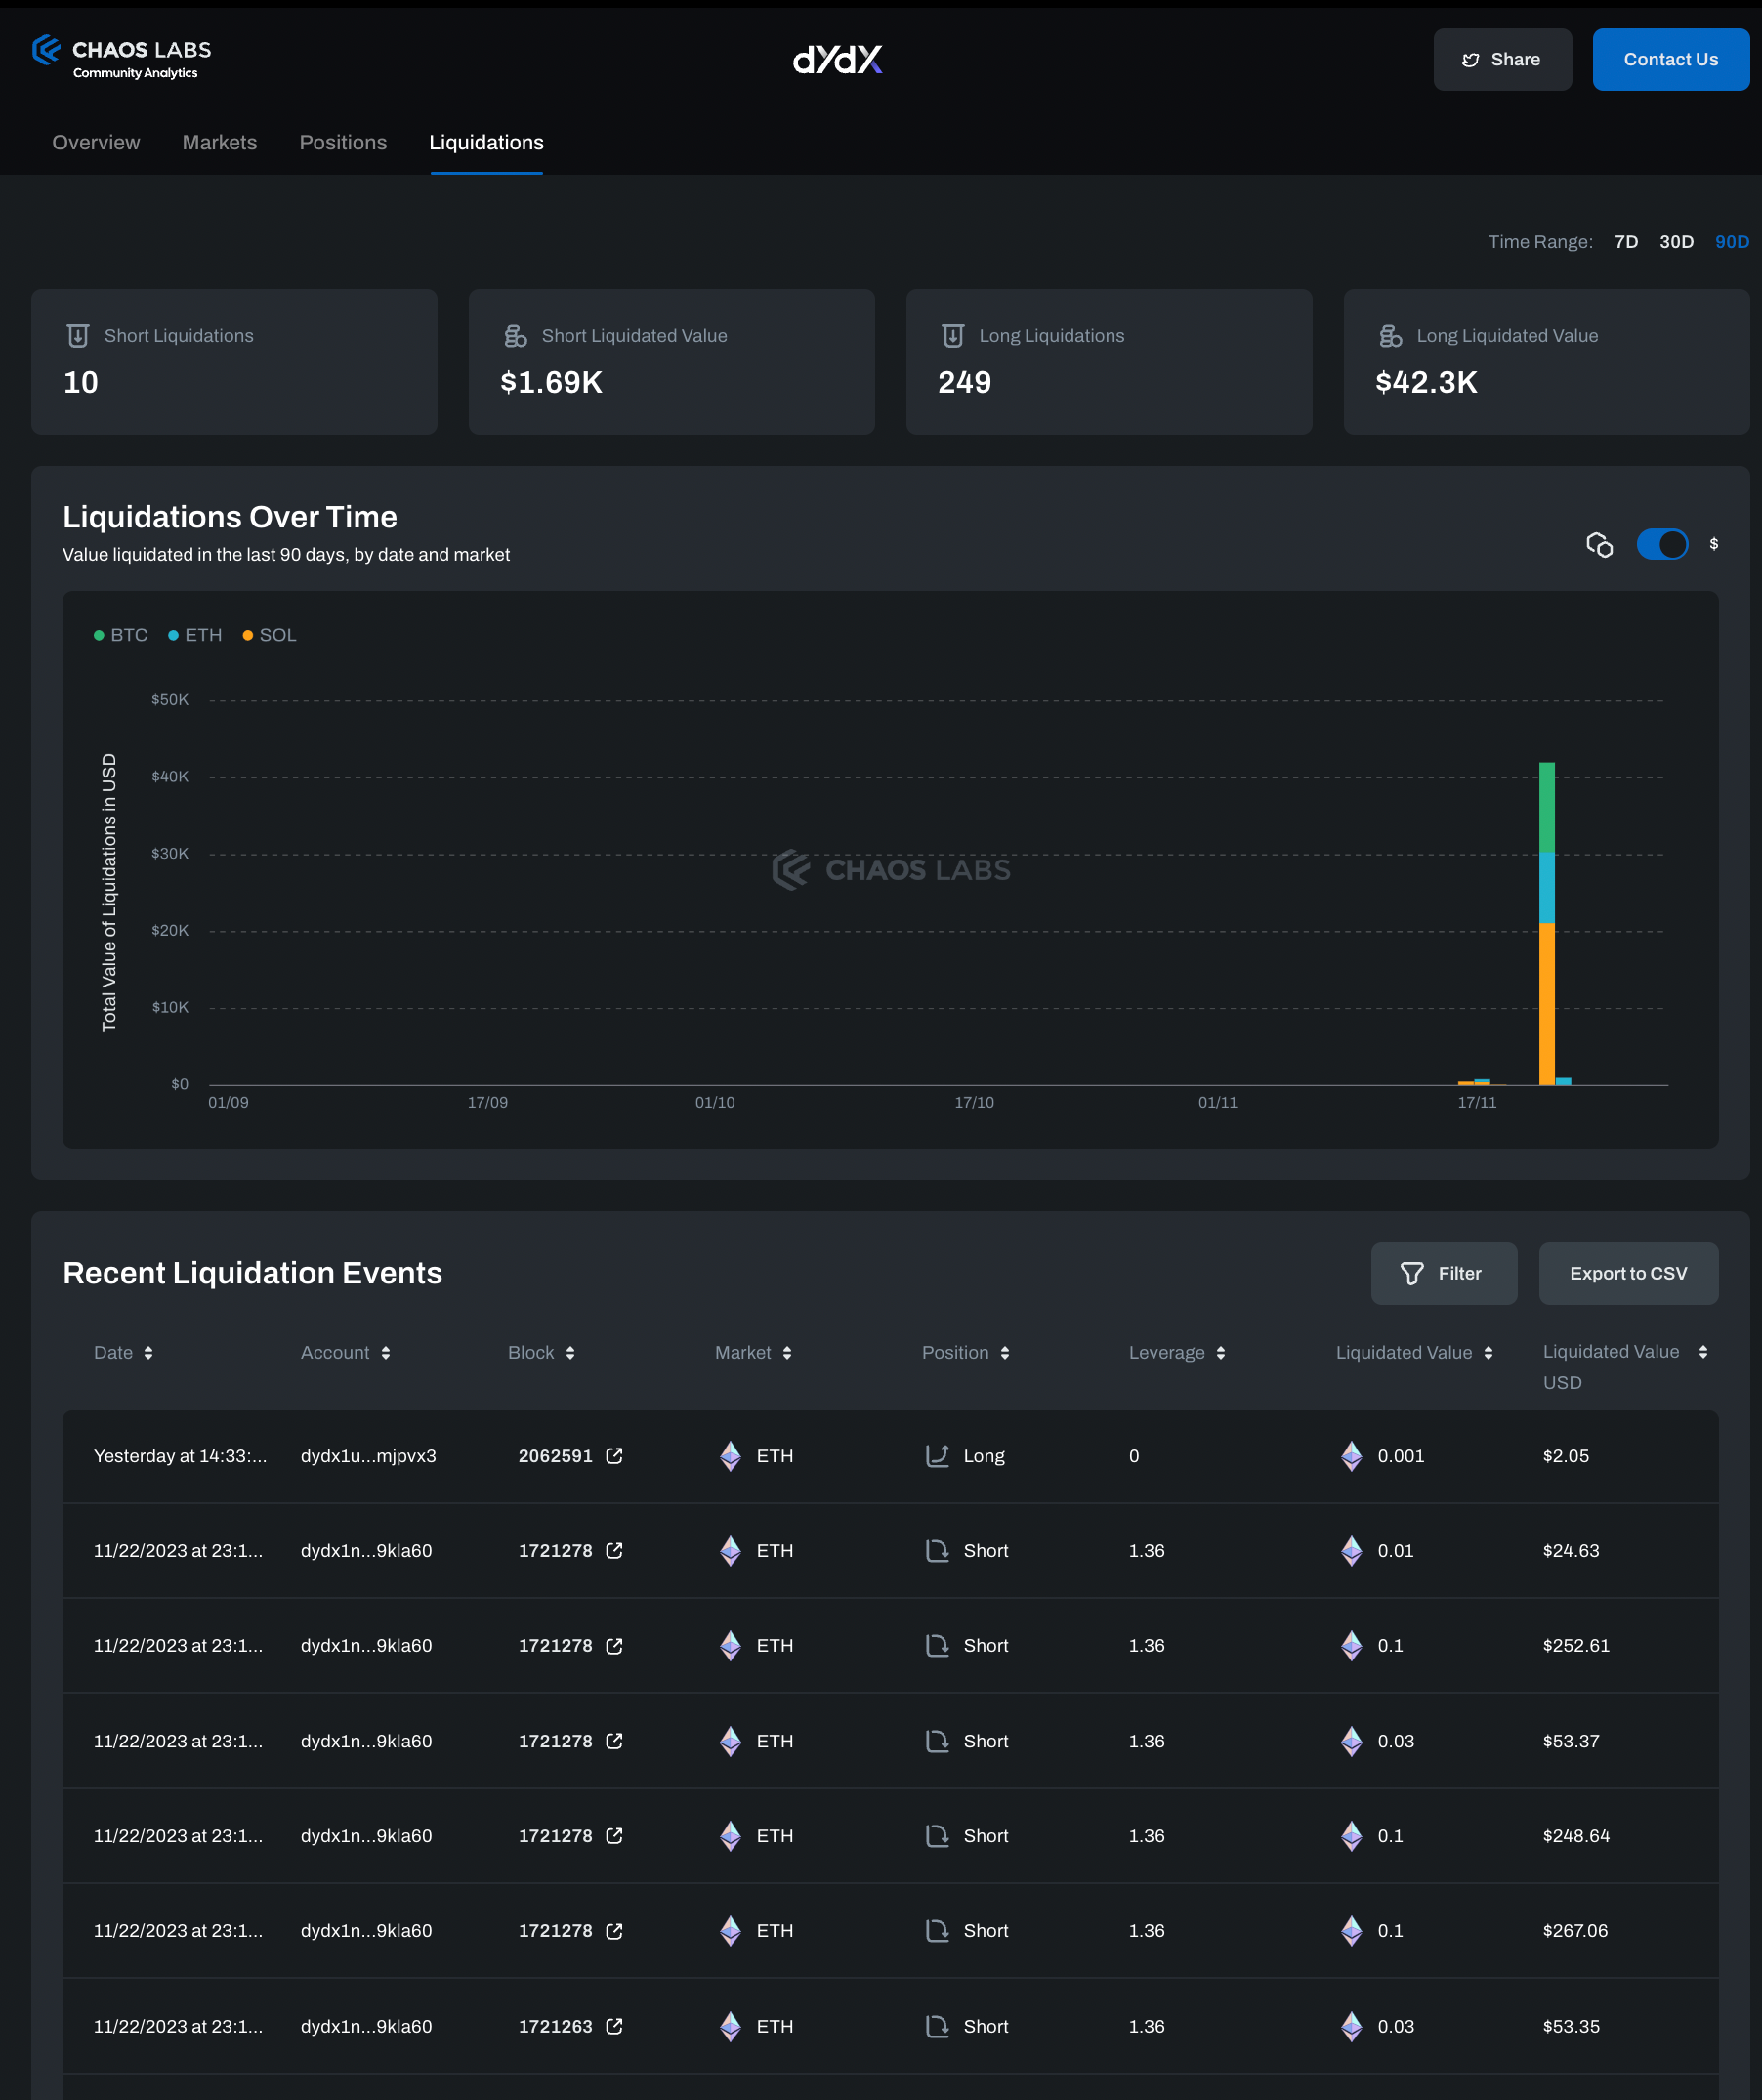
Liquidations
The Liquidations tab aggregates data on protocol liquidations over different time frames and provides graphical representations of liquidation events. This feature aids users in understanding the risk and frequency of liquidations within the protocol. The Liquidation table shows full details about each liquidation and its fills, with a link to the relevant block.
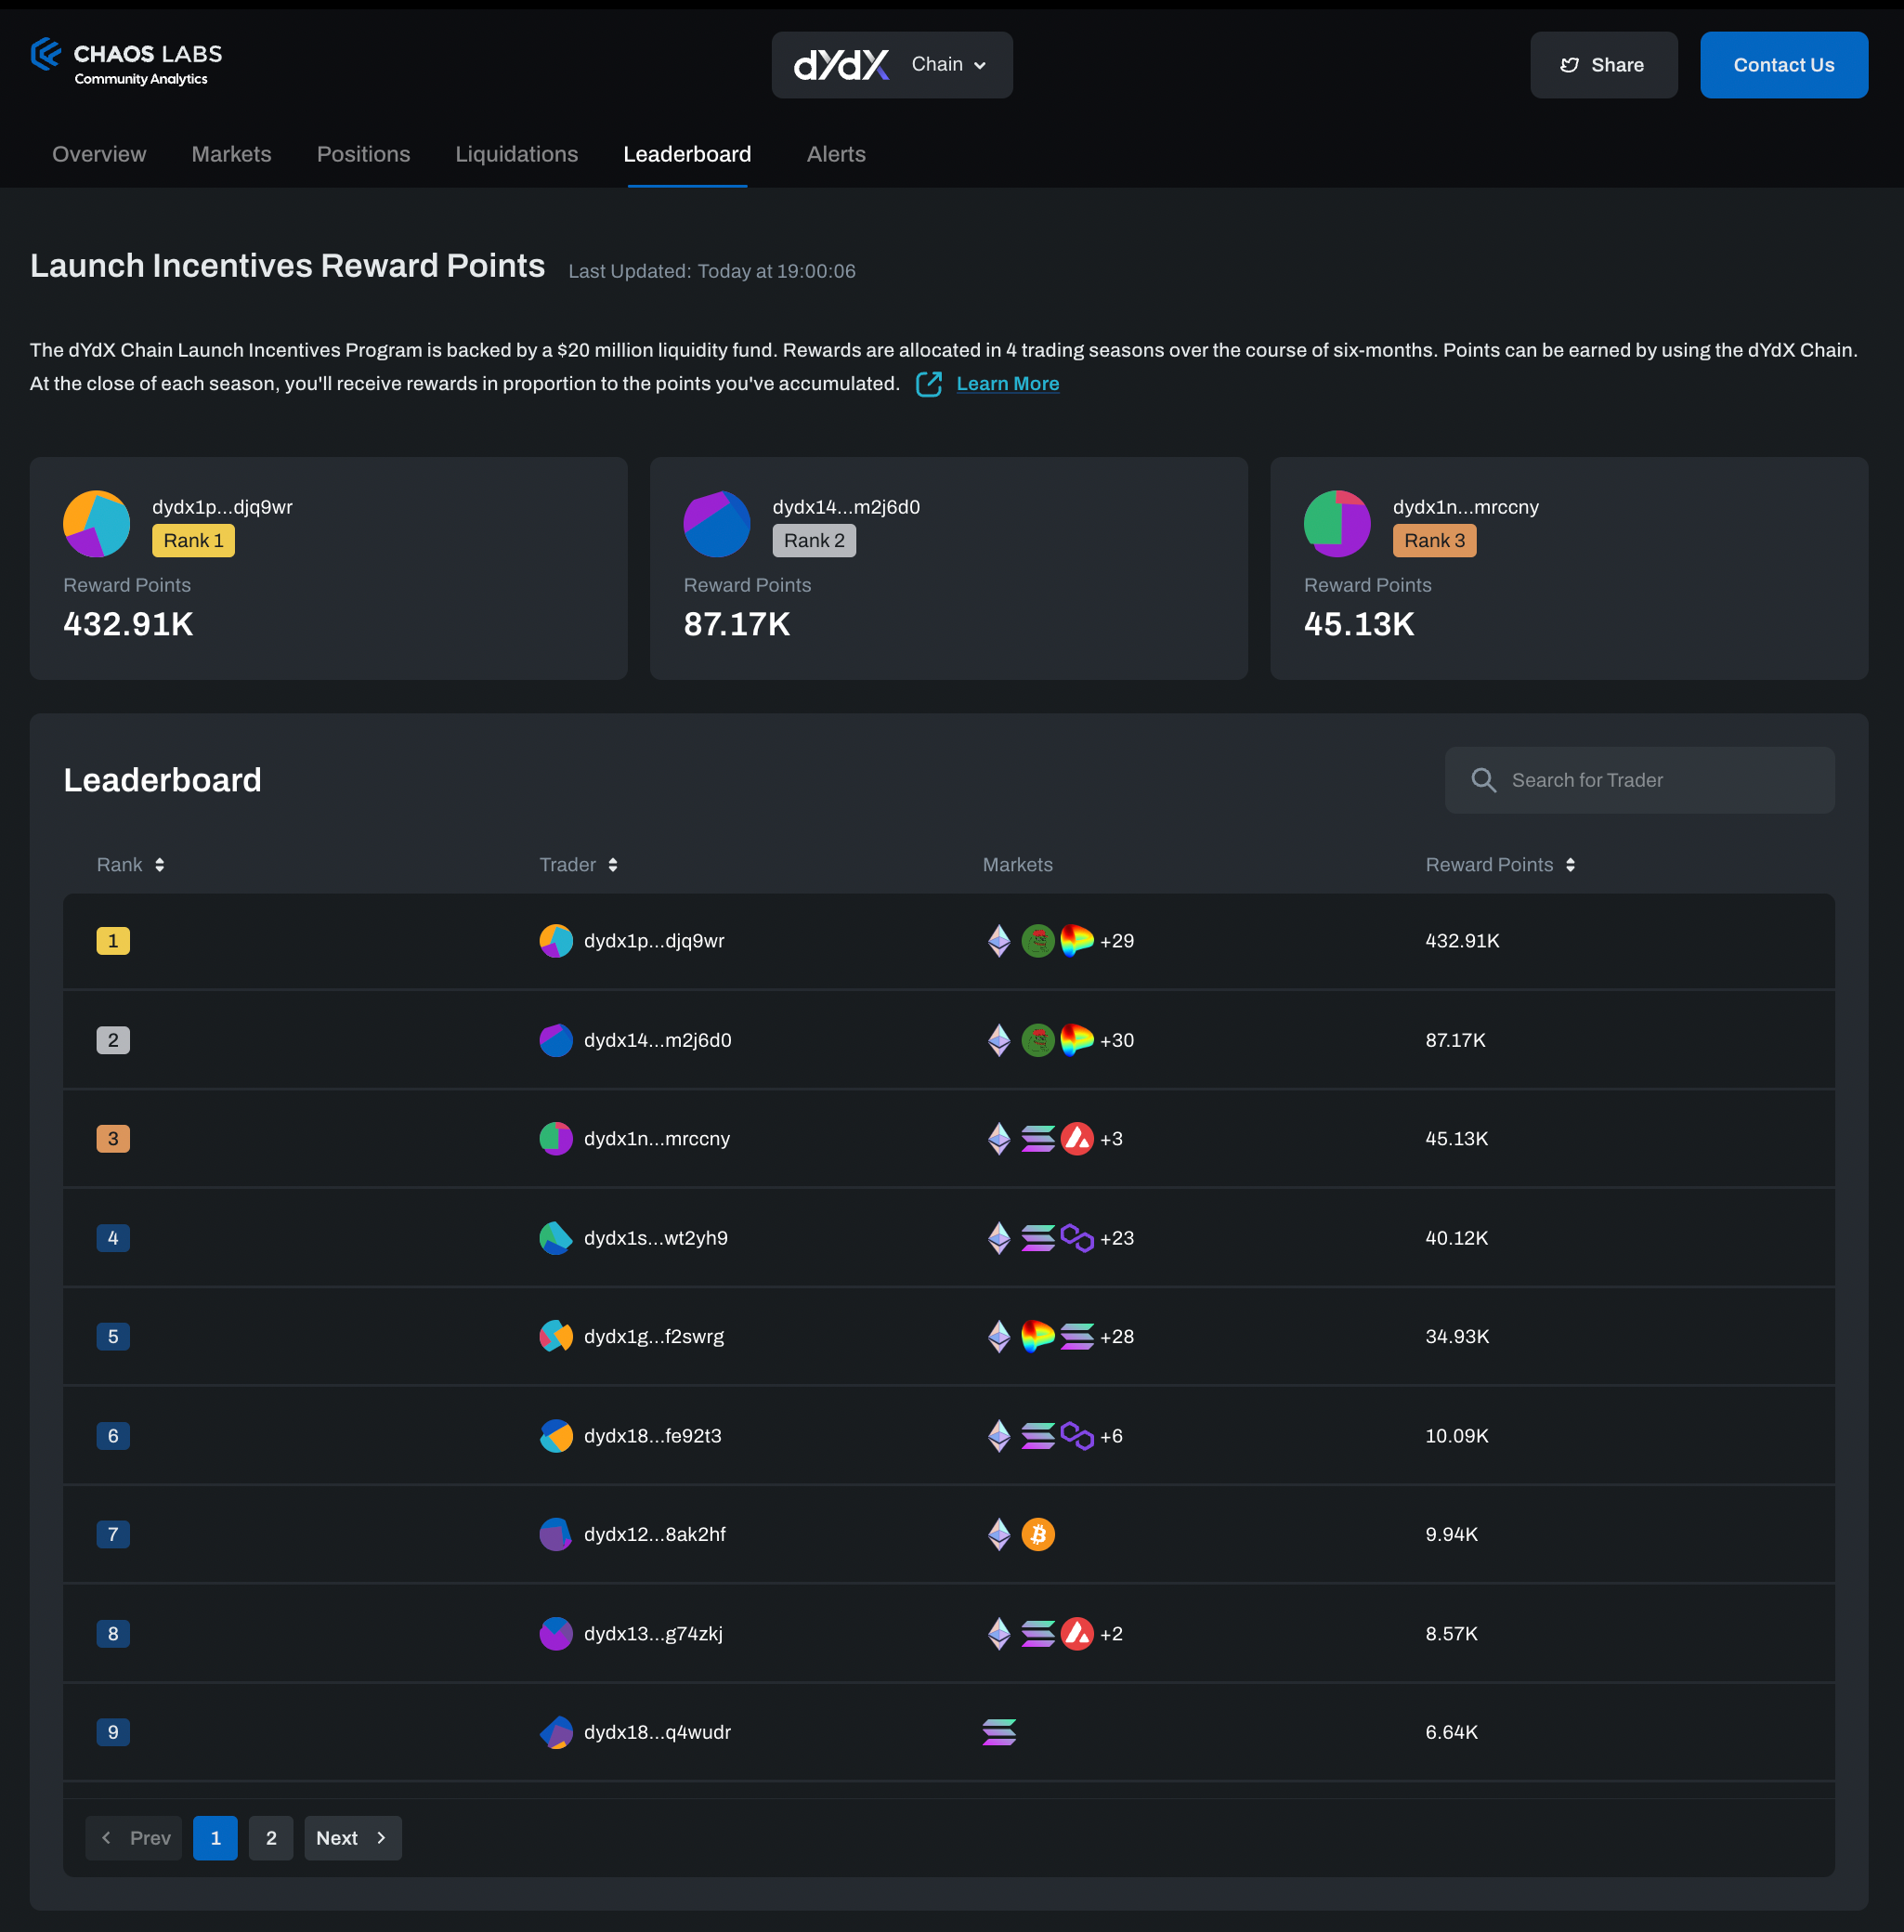
Launch Incentives Leaderboard
The Leaderboard tab shows the real-time status of Reward Points gained by traders as part of the dYdX Launch Incentives Program. The leaderboard acts as an essential tool, tracking the points accumulated by traders participating in the dYdX Chain Launch Incentives Program. It's structured to provide a clear and objective display of each trader's points balance throughout the trading seasons. The leaderboard enables traders to anticipate the rewards they stand to receive at the close of each season, based on their active engagement and trading volume on the dYdX Chain.
About the dYdX Chain Launch Incentives Program The dYdX Chain Launch Incentives Program, backed by a $20 million liquidity fund, is set to incentivize traders and market makers to onboard onto the new dYdX Chain. In this program, traders earn points reflecting the trading activity on the platform over four trading seasons. Each season lasts 4-6 weeks and presents fresh opportunities to earn rewards, with the points-based system ensuring equitable and transparent incentive allocation in line with your trading activity and market engagement.
Read more about the details of the program in our dedicated blog post.
Next steps
The launch of the Analytics and Risk Platform is part of an overall partnership between Chaos Labs and the dYdX community to support the successful launch of the dYdX Chain. As part of this collaboration, we will introduce Performance-Based rewards starting in the second trading season of the incentives program, in addition to the existing Trading Activity-Based allocation of Reward Points. The new Performance-Based rewards will be allocated using a multi-tier league-based performance competition between traders, with prizes varying between the tiers. We will share more details ahead of the second trading season.
Our platform is constantly evolving and growing to meet our users' needs. We invite the dYdX community to explore the platform and provide your feedback.
If you have any questions or comments, feel free to contact us, reach out on Twitter.
sBNB Oracle Exploit Post Mortem
Chaos Labs summarizes the snBNB oracle exploit affecting the Venus LST Isolated Pool. The post-mortem focuses on the event analysis and risk management efforts following the exploit.
The Role of Oracle Security in the DeFi Derivatives Market With Chainlink and GMX
The DeFi derivatives market is rapidly evolving, thanks to low-cost and high-throughput blockchains like Arbitrum. Minimal gas fees and short time-to-finality make possible an optimized on-chain trading experience like the one GMX offers. This innovation sets the stage for what we anticipate to be a period of explosive growth in this sector.
Risk Less.
Know More.
Get updates on our research, product, and launch.