Chaos Labs Launches the BENQI Parameter Recommendations Platform
Table of Contents
Background
As part of the risk management engagement for the BENQI Liquidity Market, Chaos Labs unveils the BENQI Parameter Recommendations Platform.
This new platform is a key component in the risk management stack protecting the BENQI protocol. During our collaboration with BENQI, Chaos Labs has worked to secure the protocol while providing the community with an extensive suite of risk products that includes the BENQI veQI Calculator, which was launched on November 2022 and built as part of our collaboration supporting Liquid Staking on the Avalanche network, and the BENQI Collateral at Risk Dashboard, which was launched on November 2022 and assists in understanding the value at risk across the protocol as well as APY earned and paid over time.
Overview
At Chaos Labs, we are strongly committed to delivering exceptional risk management services to our users. We recognize the importance of managing risk and have been focused on expanding our parameter tooling and risk analytics to better support the BENQI community and provide transparency into the parameter recommendation process.
Following our review of the current risk parameters of the BENQI Lend & Borrow platform through simulations and data models, we are pleased to share the BENQI Parameter Recommendations Platform. This dashboard provides ongoing and automated risk management for the BENQI protocol. Users can access real-time simulation results and detailed information about simulation runs within the portal, making it easier to identify the tradeoffs between specific parameters.
Platform Deep Dive
This section is designed to offer a comprehensive look at the platform as it currently stands. It gives the BENQI community access to an overview of the application, presented in an easy-to-use format.
Home Page
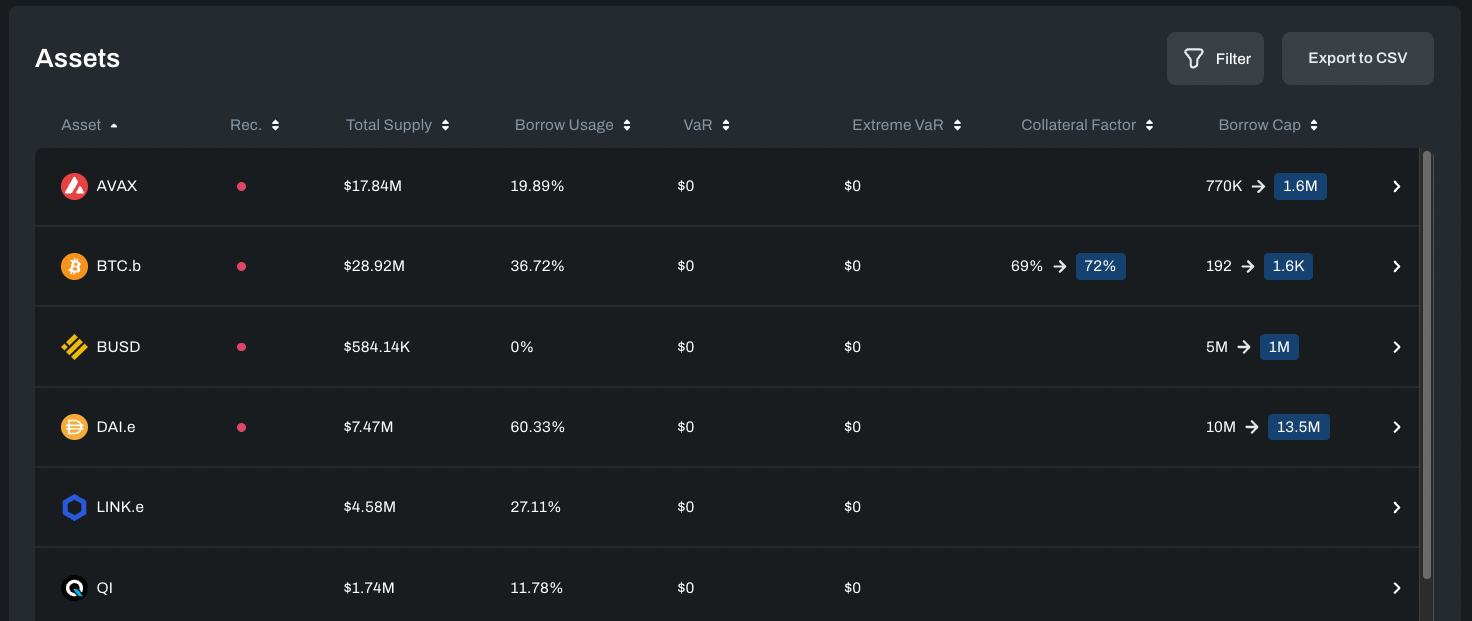
On this page, users can see an overview of all supported assets, with a filter option to find the assets they are most interested in.
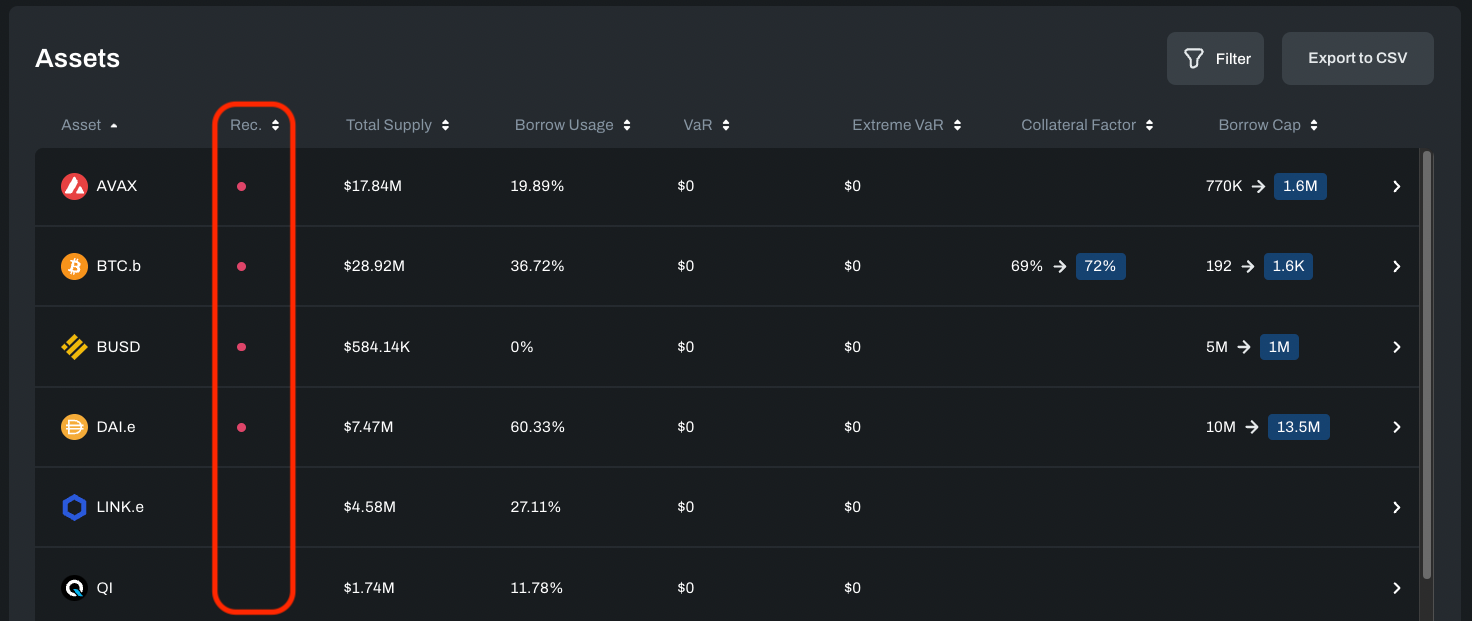
The Rec. column indicates whether Chaos recommends updating parameter values for that specific asset (represented by a red dot).
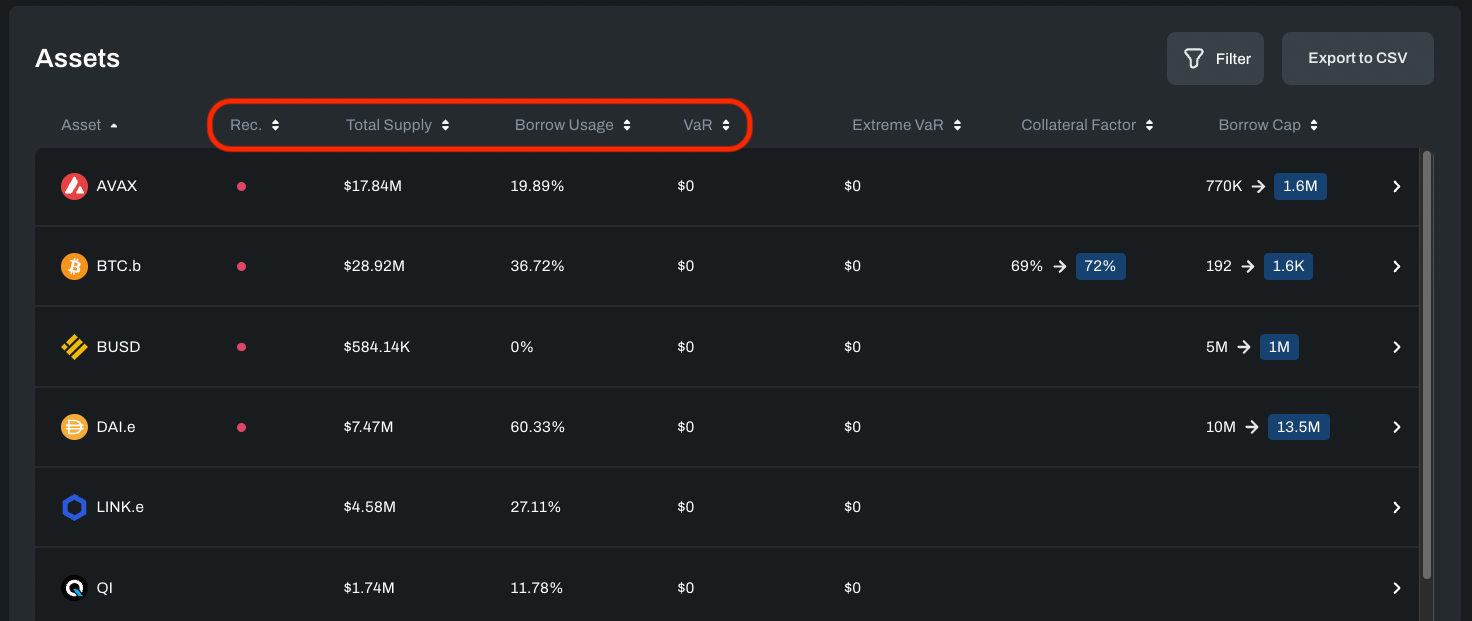
The next four columns highlight the current state of Total Supply, Capital Efficiency (Borrow Usage), and risk (VaR). The Extreme VaR is the 99th percentile of Bad Debt observed through simulations of extreme market conditions.
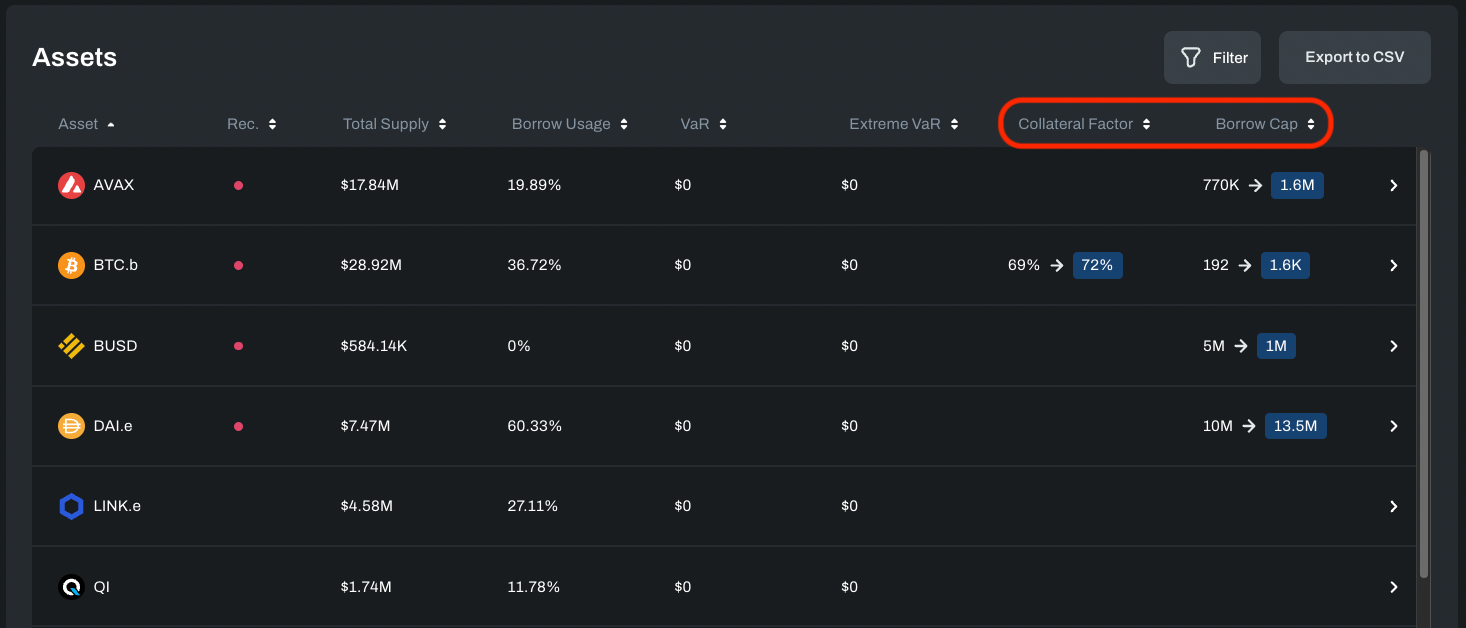
The last two columns highlight the Collateral Factor and Borrow Cap showing both the current values and recommended parameters’ values.
💡 You can click into the different rows, which will take you to a dedicated Asset page, diving deeper into specific parameter recommendations from Chaos for that asset.
Asset Recommendations
The Asset page highlights the recommended values for Collateral Factor and Borrow Cap. In addition, users can see the simulated Borrow Usage, VaR, and Extreme VaR under the recommended parameters.
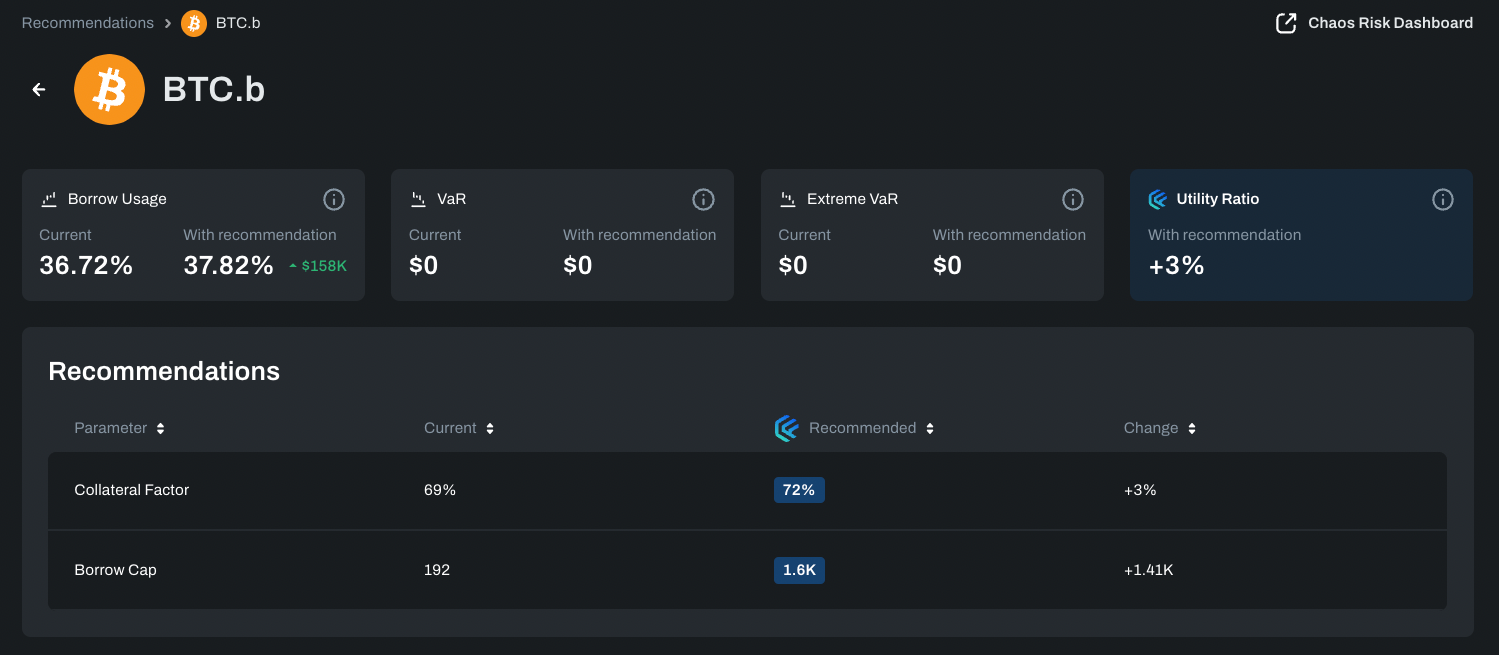
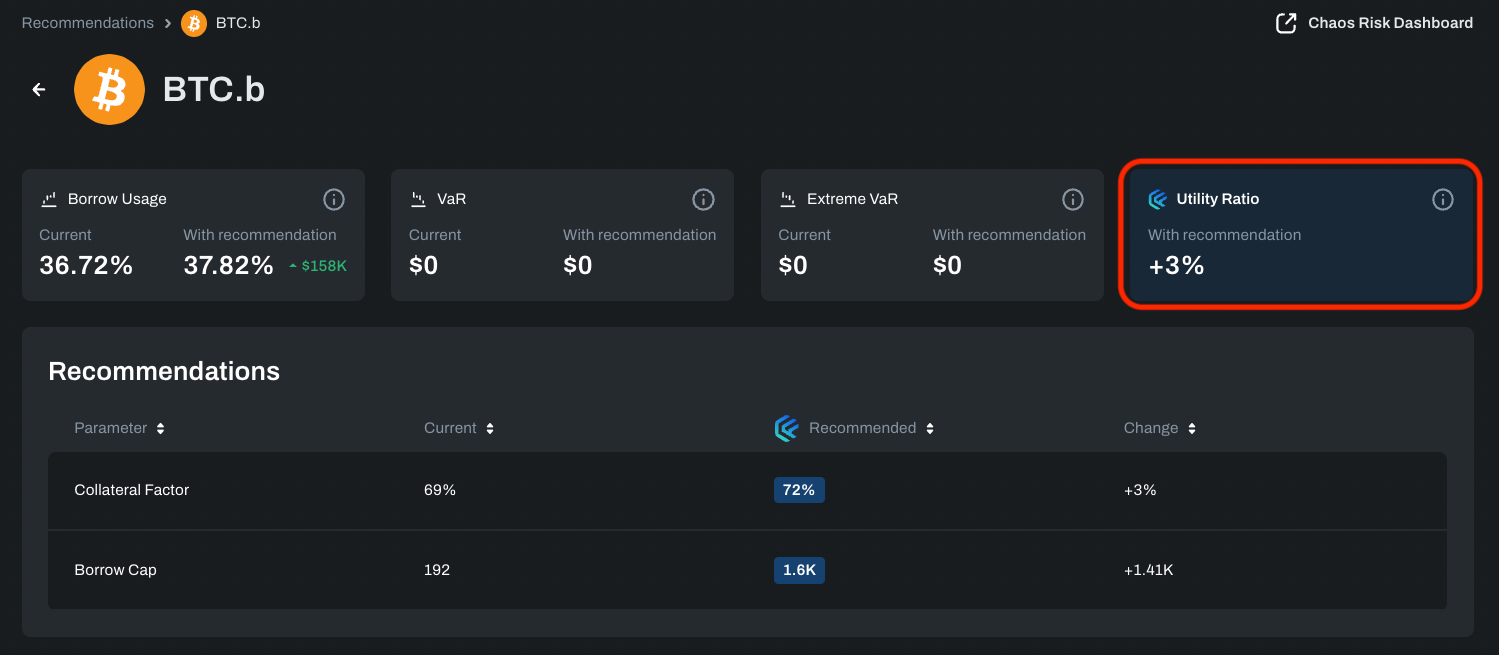
In addition, we highlight the “Utility Ratio,” which is the key metric Chaos uses to show Potential improvement in asset Risk / Return ratio compared to the current state, calculated as the change in borrows divided by the change in bad debt.
Below, you can see the asset utilization and insolvency risks to set optimal value for Borrow Cap.

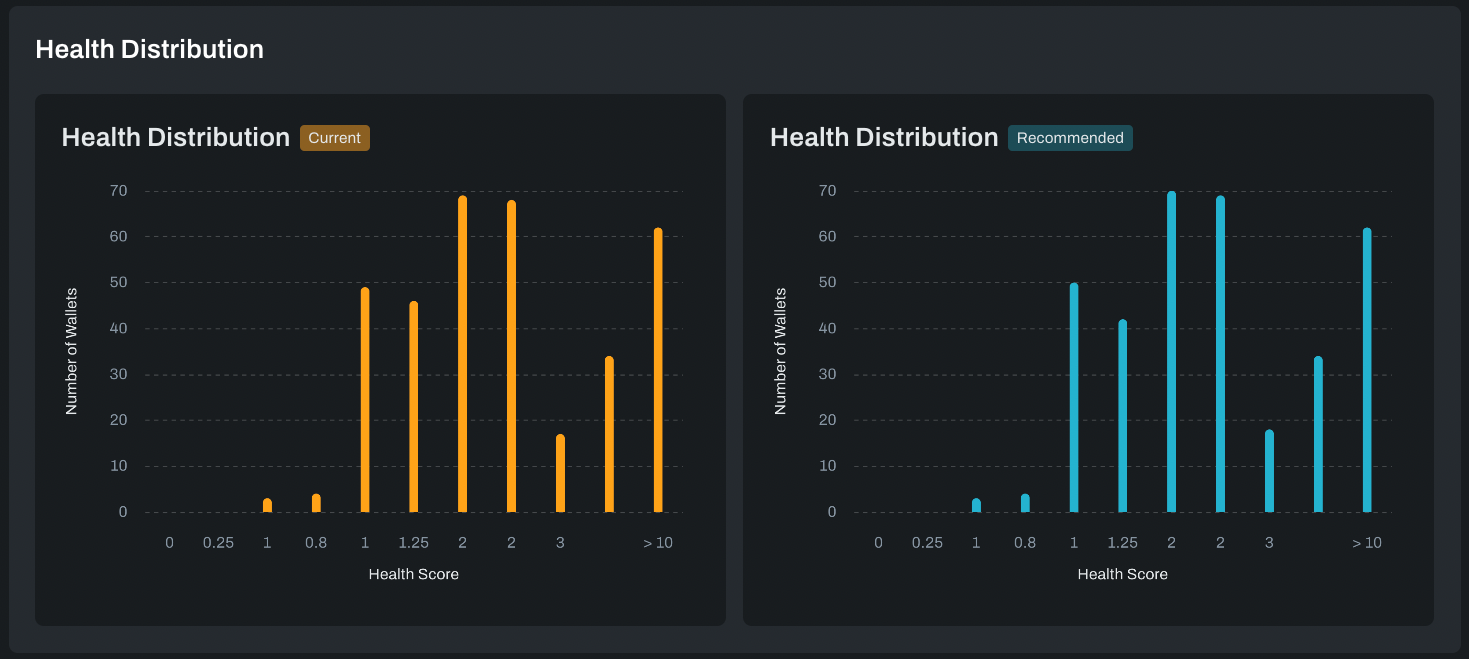
If you keep scrolling, you can see the health distribution of wallets with the current and recommended parameters. This is shown in cases where the recommendation will change the health distribution by updating collateral factor. In any case that the recommended values will cause wallets’ health to be < 1 (and hence eligible for liquidation) a list of all wallets at risk of liquidation will also be shown.
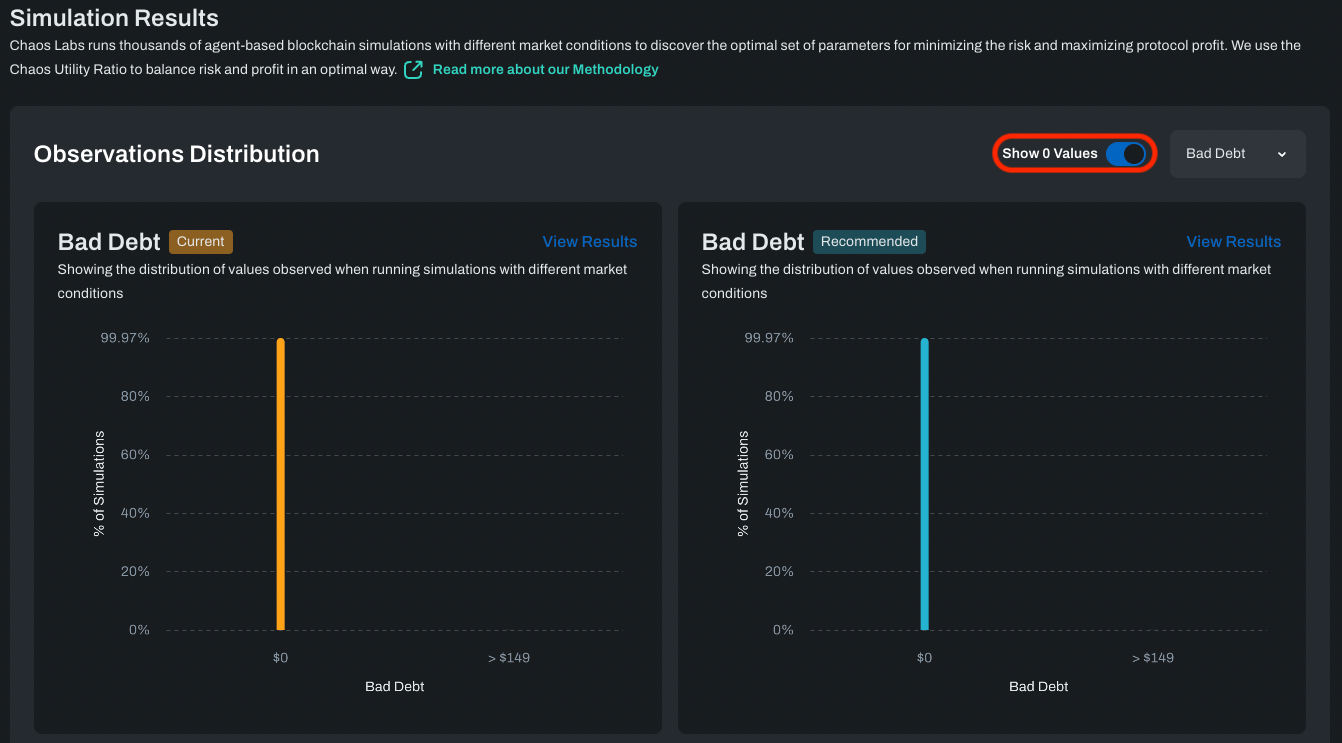
Scrolling down a little bit, we get to the simulation results graphs. The first pair of graphs displays the distribution of bad debt observed given the current and recommended parameters over the course of thousands of simulations of different market conditions.
The chart on the left is the pattern of simulation results given the current parameters in place, and the chart on the right is the pattern of values given the recommended parameters.
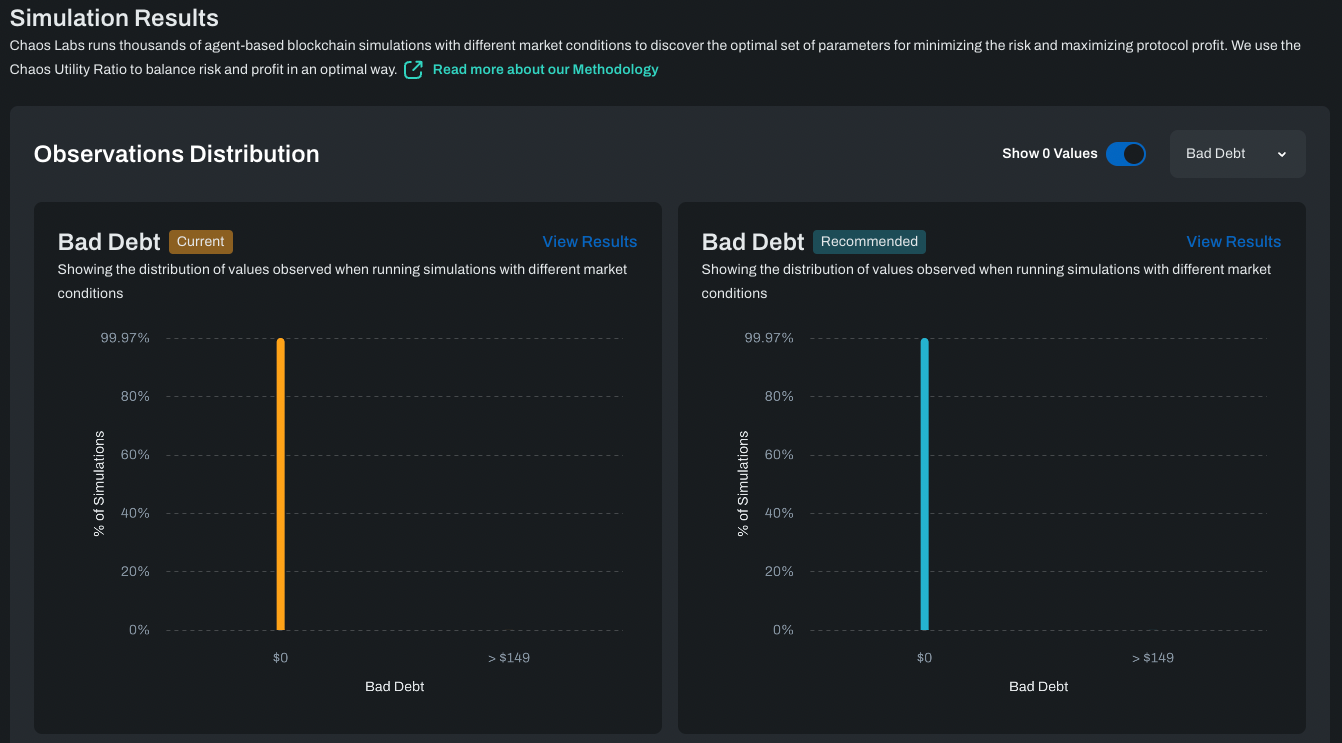
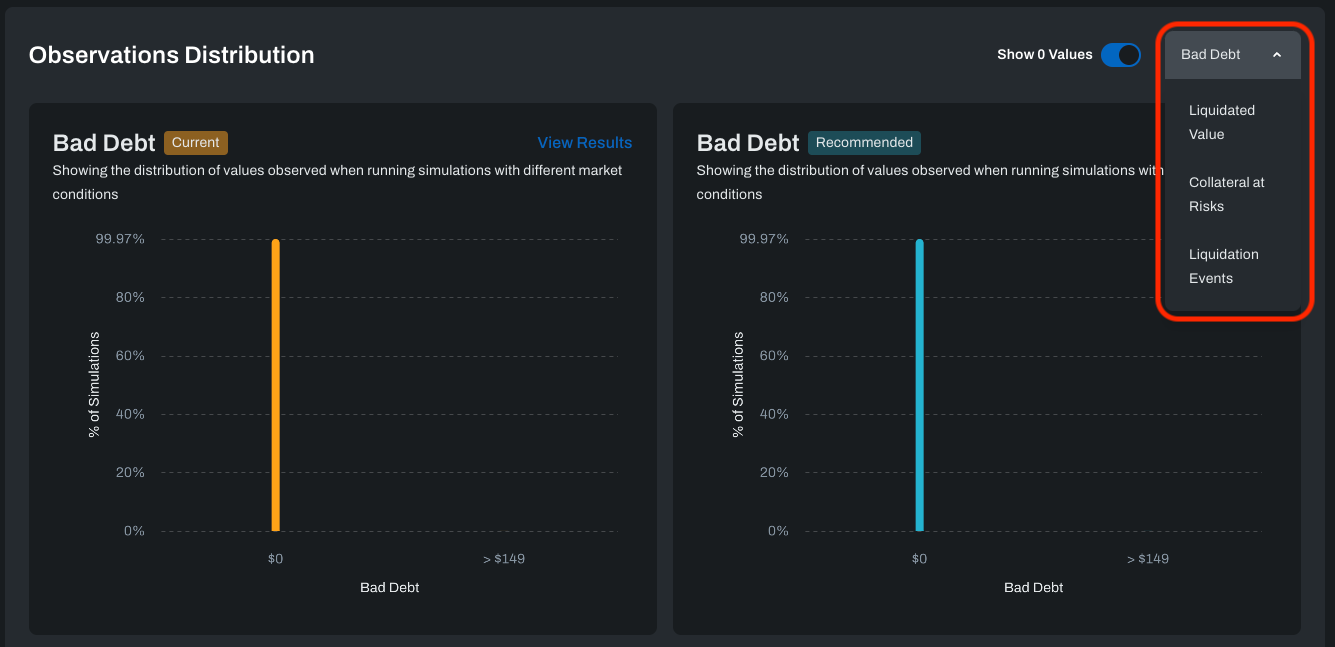
The default graphs observed are ‘Bad Debt.’ By using the drop-down menu, users can also look at ‘Liquidated Value’, ‘Collateral at Risks' or ‘Liquidation Events':
By default, Observer Distribution filters out all 0 results, so focusing on the non-zero values is easier. To see all values, including 0 samples, use the ‘Show 0 values’ toggle.
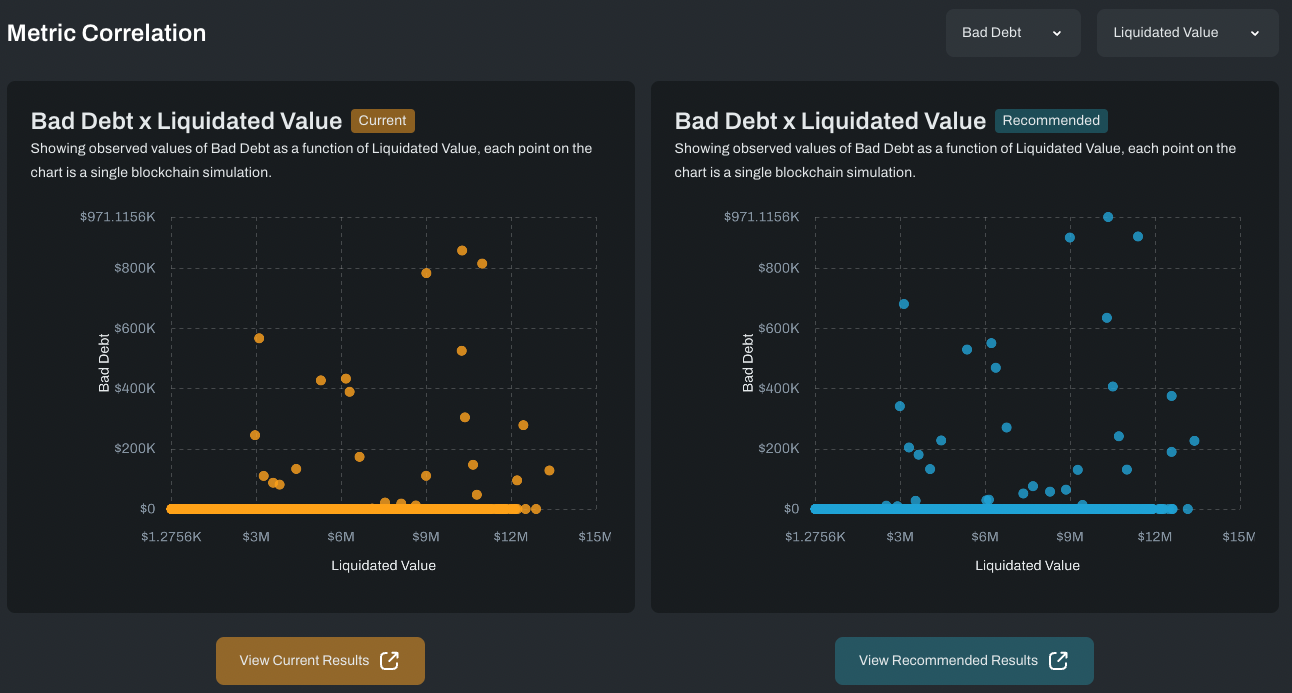
Directly below, we have a set of panels showing correlations between two values within the simulations. As before, the chart on the left shows correlations between, i.e., the current values for ‘Bad Debt’ and ‘Liquidated Value,’ while the chart on the right shows correlations between those same metrics, but on simulations run with the recommended parameters.
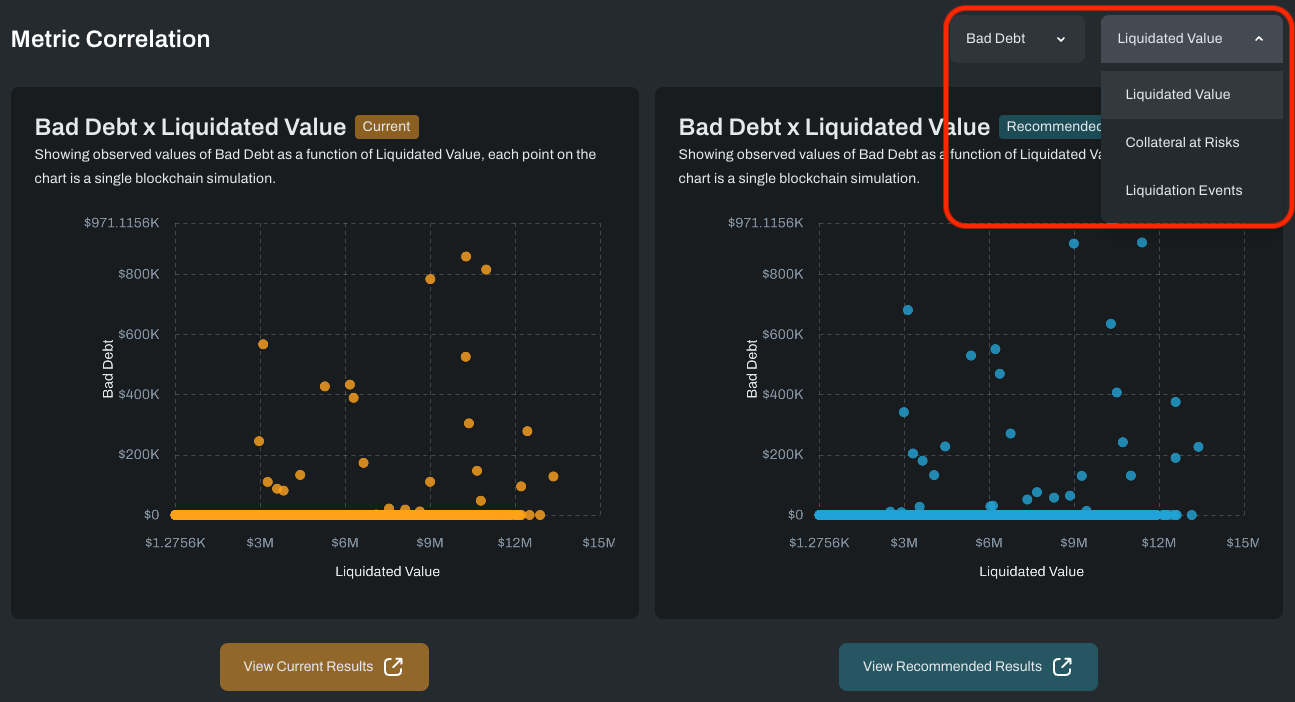
If you want to display correlations between two different values, you can use the drop-down menu:
Next steps
Our platform is constantly evolving and growing to meet our users' needs. We invite the BENQI community to explore the platform and provide your feedback.
If you have any questions or comments, feel free to contact us on Twitter or email us at [email protected].
Related Posts
- Chaos Labs Launches Benqi Risk Dashboard (November 23, 2022)
- Chaos Labs <> Benqi veQI Calculator (November 2, 2022)
- Benqi veQI Economic Analysis (September 20, 2022)
- Chaos Labs Collaborates with Benqi For Liquid Staking Analytics (August 14, 2022)
Chaos Risk Dashboard Launches Live Alerts for Real-Time Risk Management
Chaos Risk Dashboard has rolled out new functionality that provides real-time alerts covering crucial indicators on the Aave v3 Risk Dashboard and BENQI Risk Dashboard.
Chaos Labs Asset Protection Tool
Chaos is unveiling a new tool to measure price manipulation risk and protect against it. Introducing the Chaos Labs Asset Protection Tool
Risk Less.
Know More.
Get priority access to the most powerful financial intelligence tool on the market.