dYdX Chain: End of Season 4 Launch Incentive Analysis
Overview
Chaos Labs is pleased to provide a comprehensive review of the fourth trading season on the dYdX Chain. This analysis encompasses all facets of exchange performance, emphasizing the impact of the Launch Incentive Program.
We are diligently fine-tuning the incentives, ensuring they effectively meet their intended goals. By monitoring a broad spectrum of indicators, we aim to understand the rewards program's dynamics and outcomes.
Key Stats:
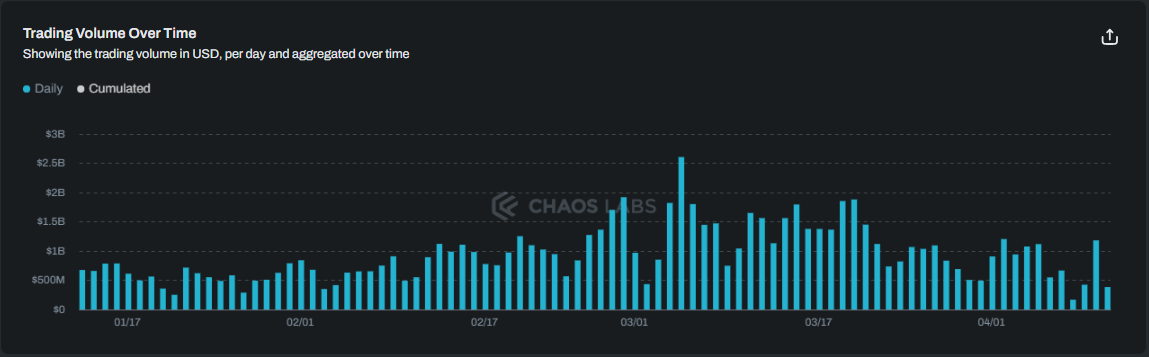
- dYdX Chain has seen over $51bn in trading volume across 67 live markets.
- Over 5300 traders actively earn points through season 4 of the launch incentive program.
- Funding rates have been more muted on the dYdX Chain this season. This can be attributed to lower volatility generally.
- The dYdX Chain has grown to approximately $126m USDC in TVL deposited on the exchange at the end of season 4, up 10% from the beginning of the season.
dYdX Chain Trading
The dYdX Chain has seen over $51bn in trading volume across 67 live markets. This is a decrease of 7% on season 3 volumes. The growth seen in the previous season continues to compound, particularly whenever markets exhibit upside volatility.
Most positively, the number of active trades continues to increase as the trader base grows, setting dYdX up for long-term sustainable growth.
The launch incentive program’s focus on rewarding traders migrating their activity to the dYdX Chain early has had a significant effect as daily volumes have continued to trend higher.
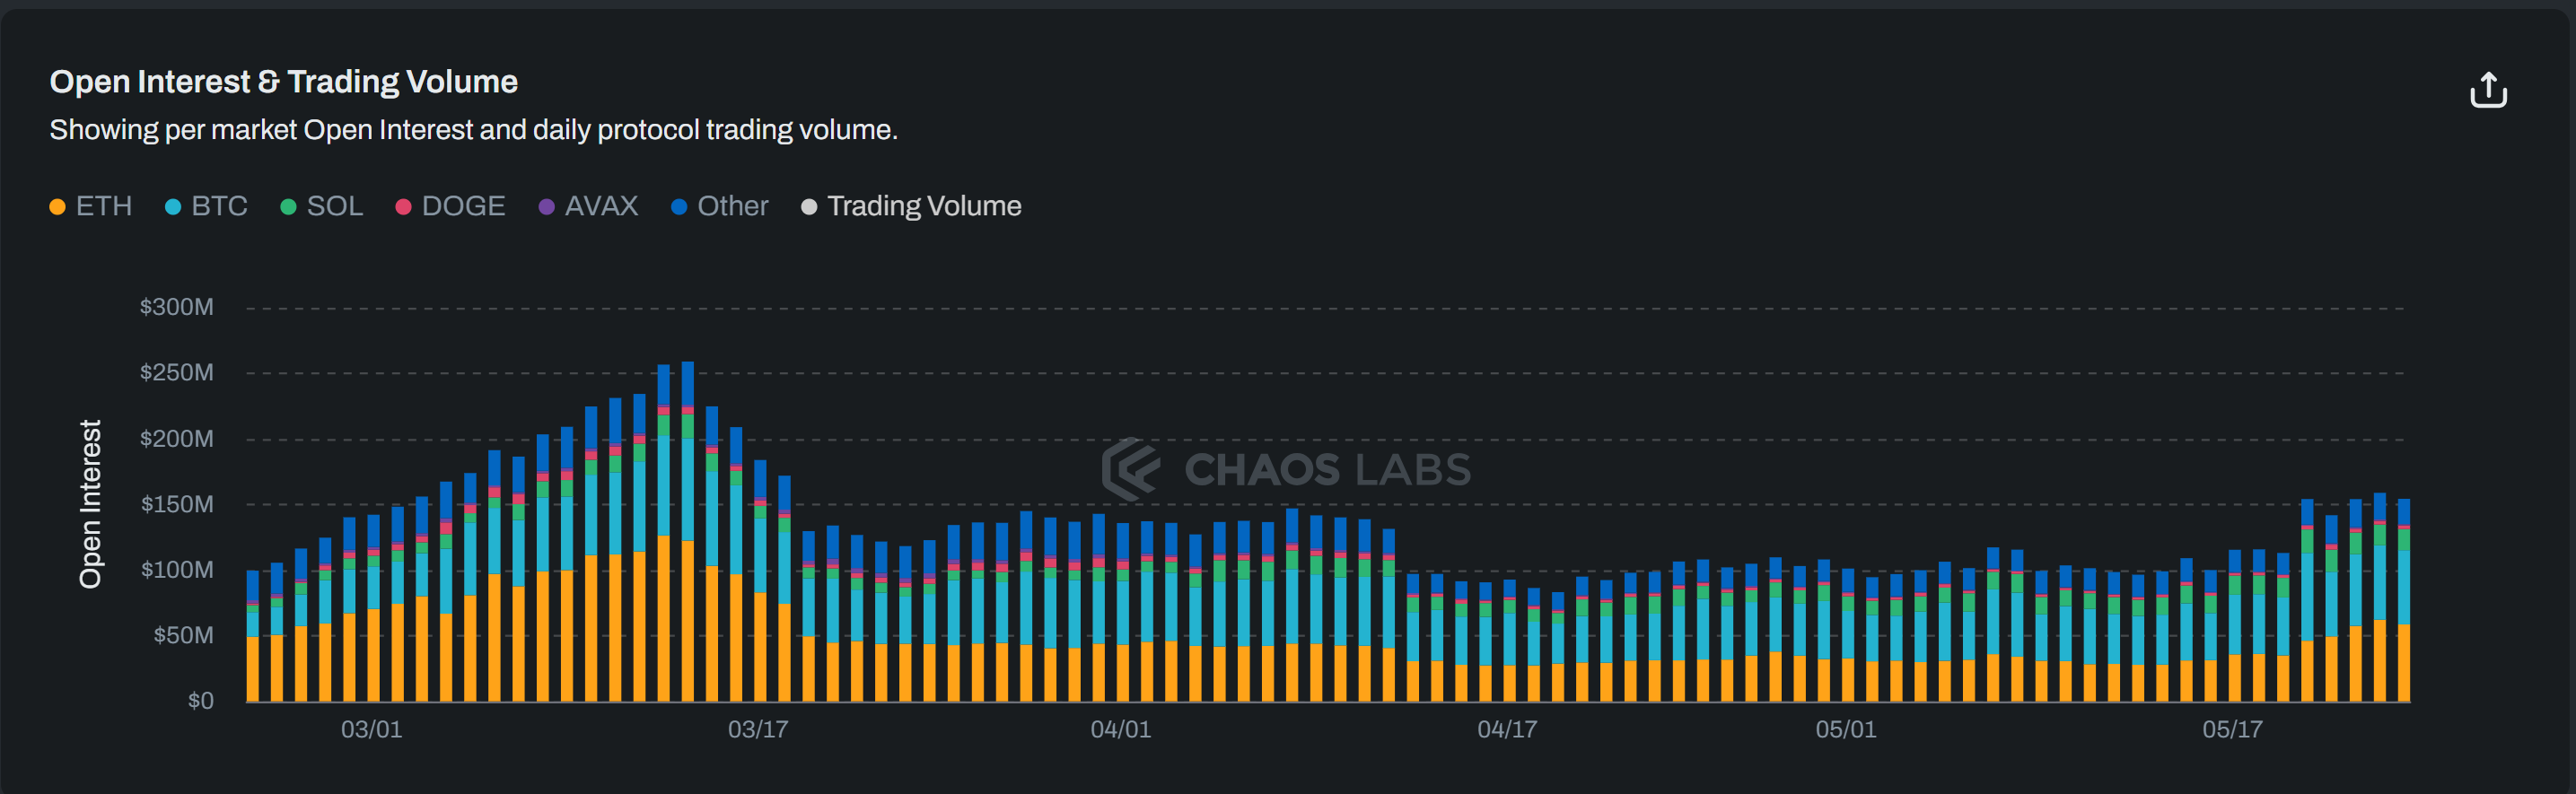
Open interest has increased slightly over the season from $140m to $152m. The lower volatility experienced has caused less variability in open interest. The trend towards steady growth despite lower volumes signals a maturing of the dYdX Chain.
Open interest fluctuates significantly with market conditions, but the overall trend is consistently higher peaks and higher troughs.
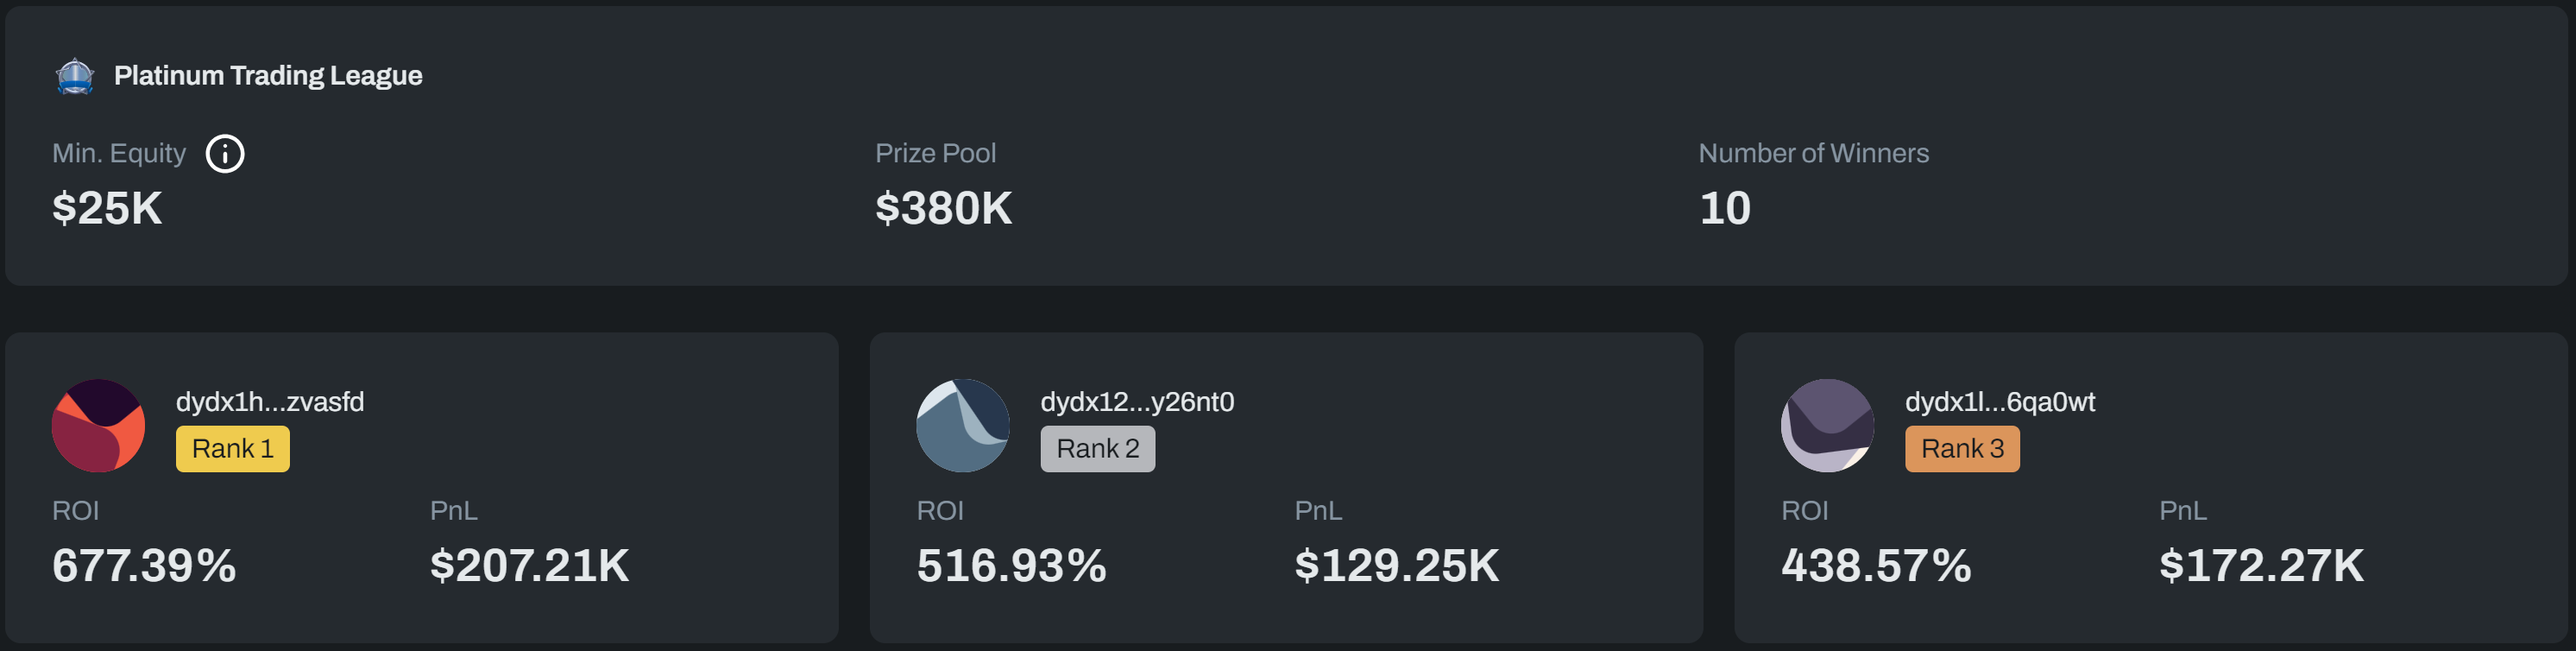
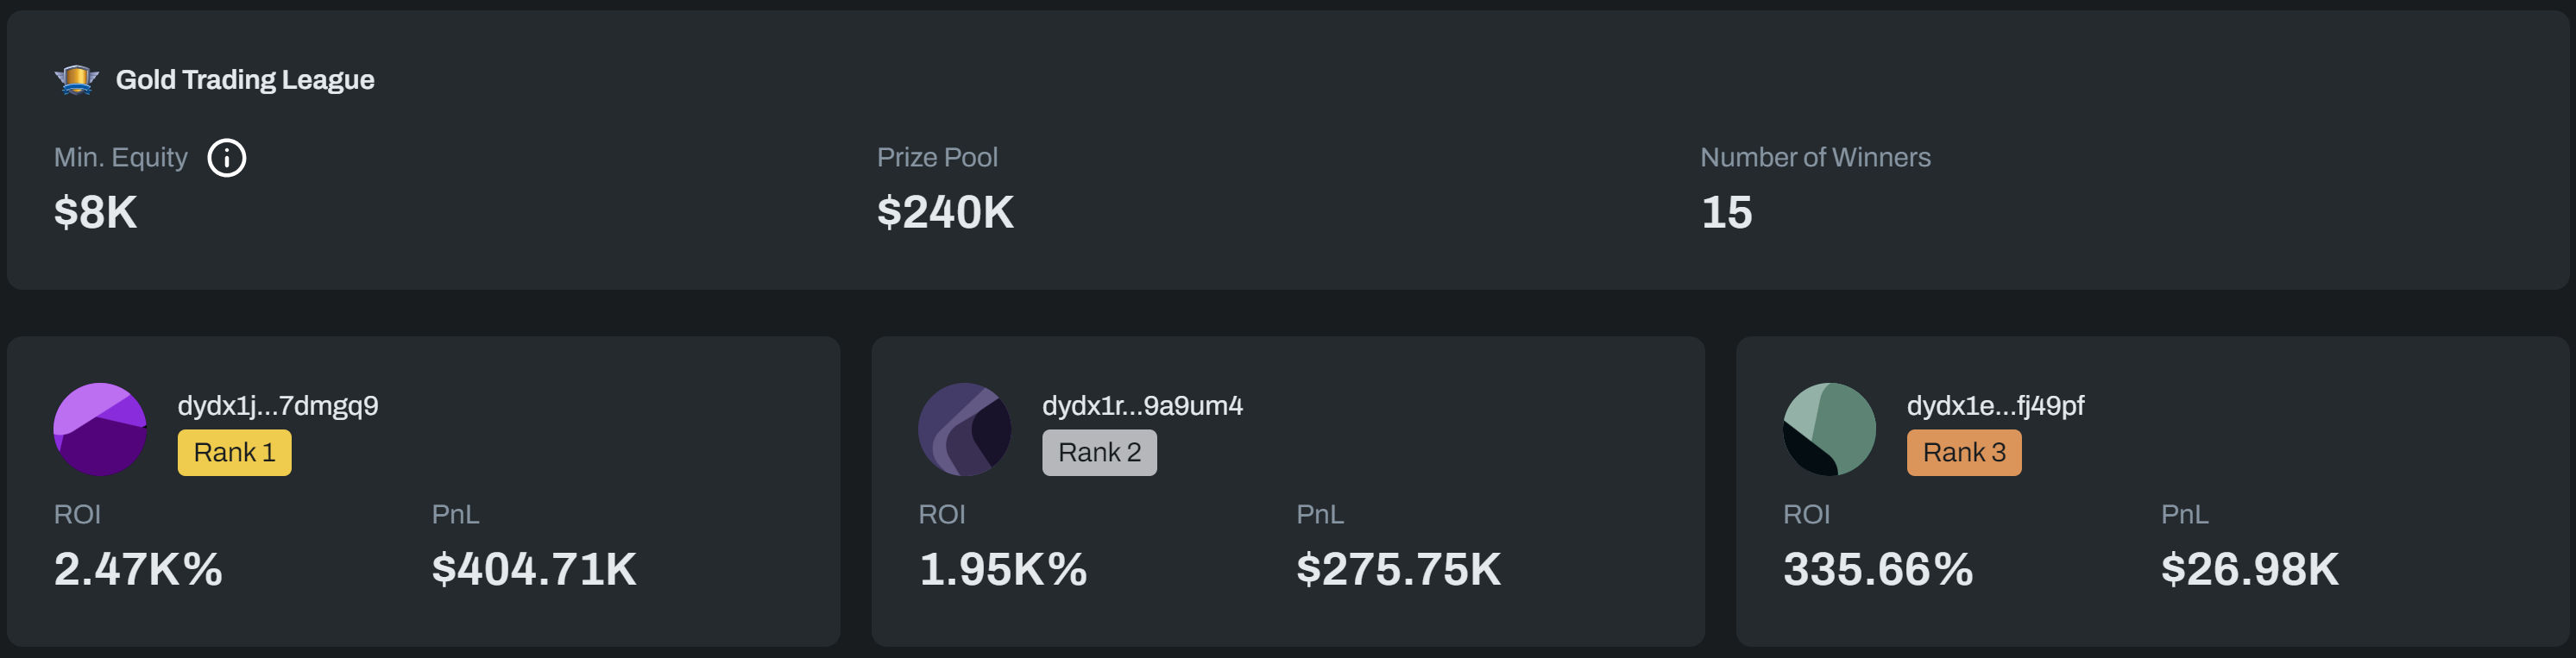
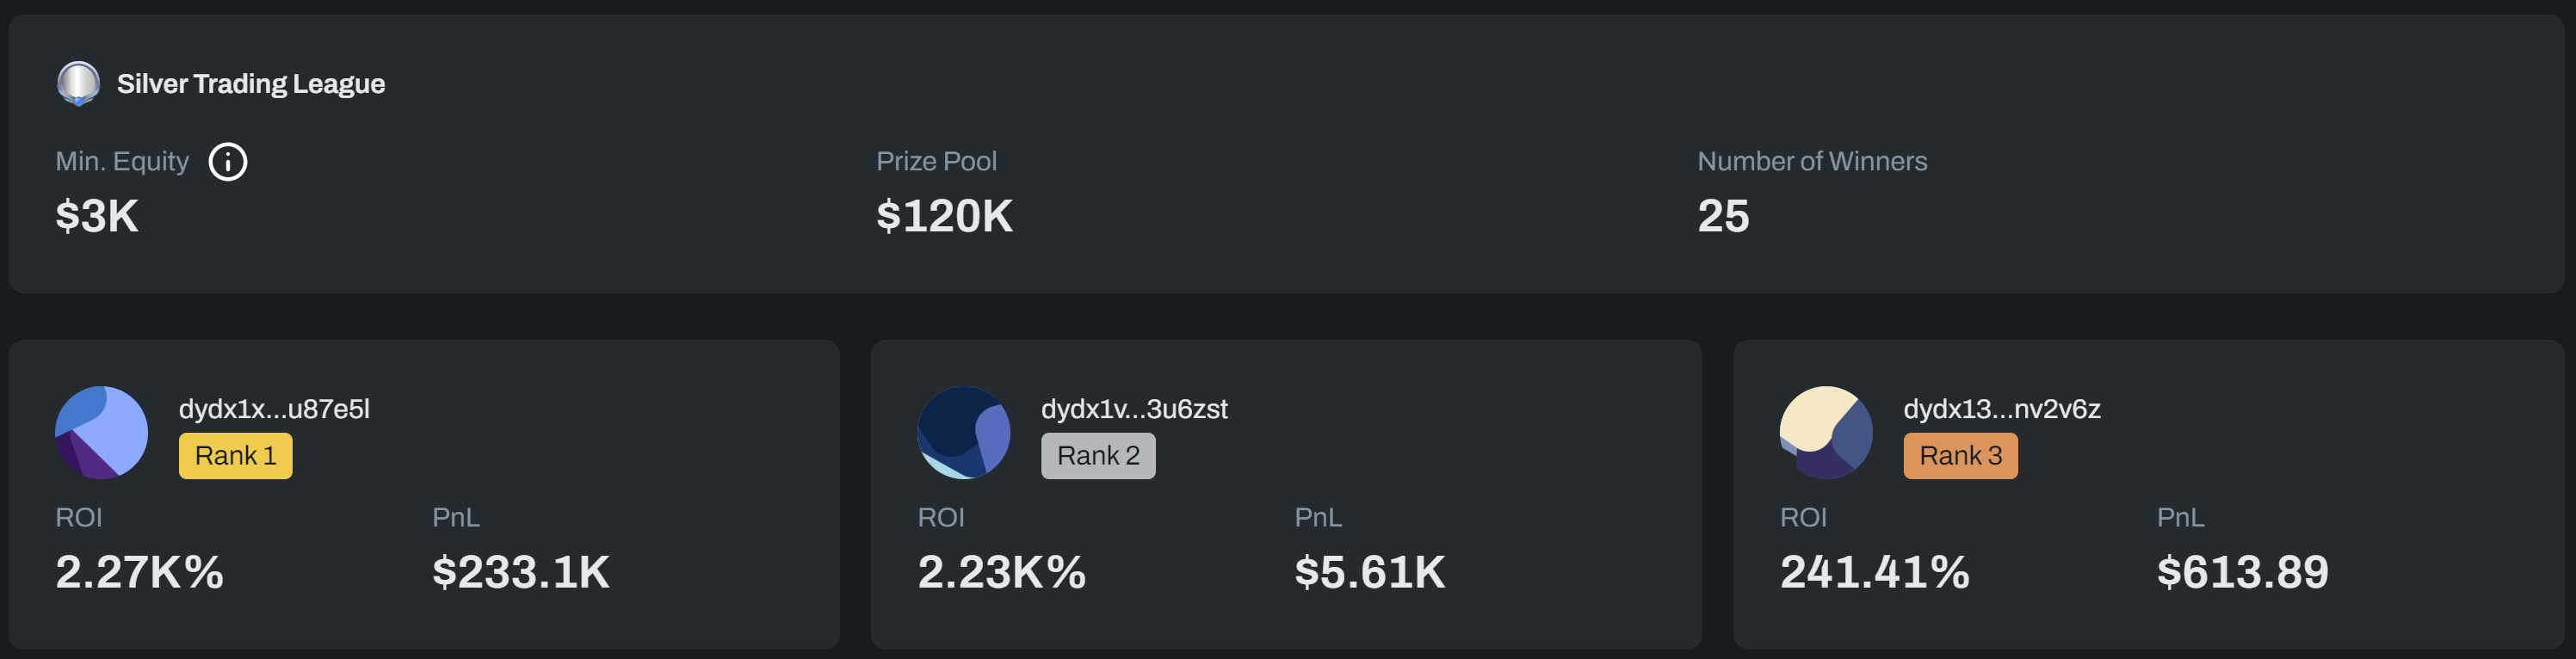
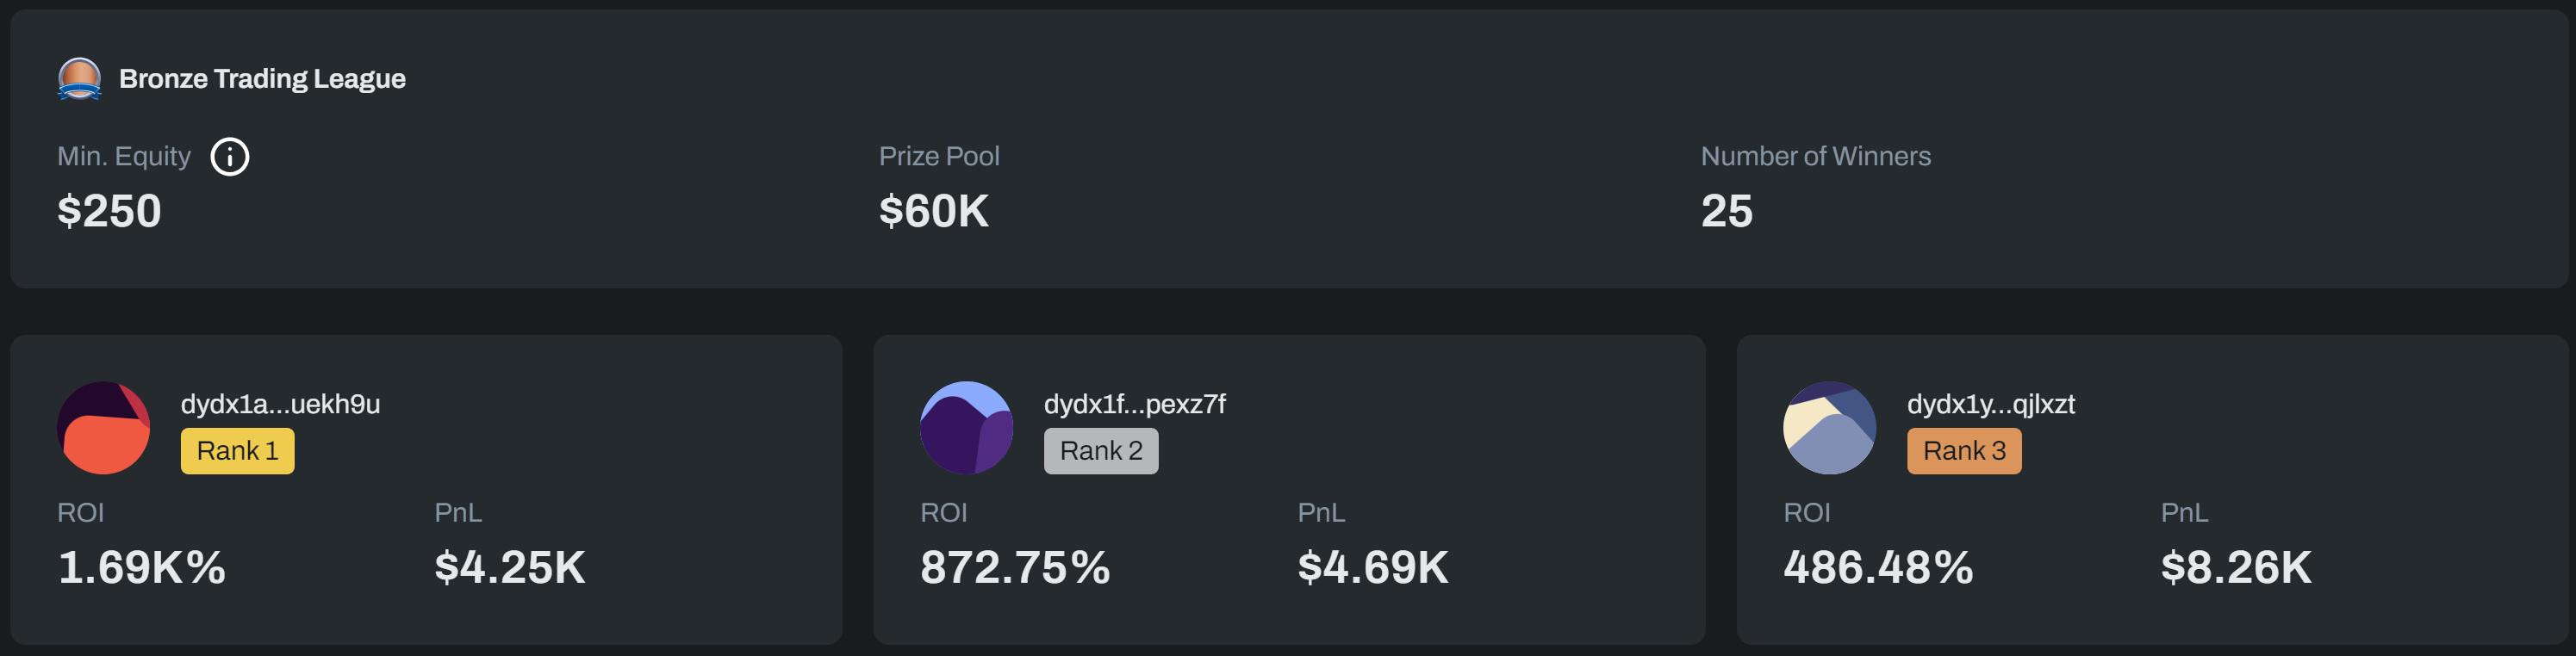
And there have been some incredible trading performances in the leagues as a result. The leagues are intended to motivate traders to invest their time and energy into improving their trading performance. This leads to them gaining more enjoyment and utility from the dYdX Chain.
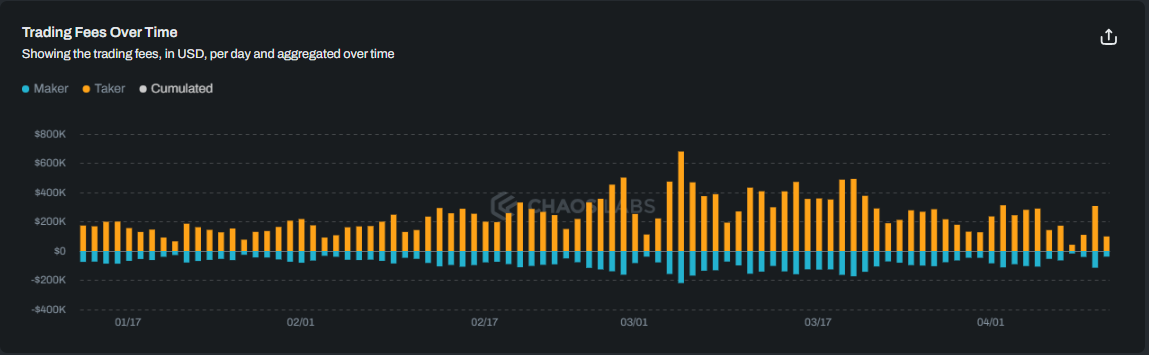
Traders have paid almost $25m in fees to stakers securing the dYdX Chain since inception. $8.3m of this came in season 4 of the launch incentive program.
dYdX Chain Liquidity
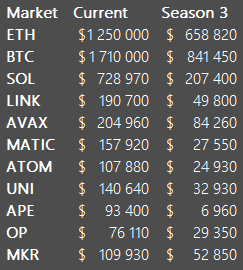
Liquidity in the majors, as measured by median liquidity within 100bps, has improved dramatically over season 4, particularly in the more developed markets. Most large markets' liquidity has more than doubled over the season, which is a significant positive development.
See the table below for liquidity trends in some major markets.
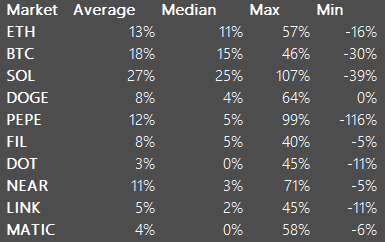
Funding
Average funding rates in most major markets have been well contained in season 4, reducing in magnitude and volatility from season 3. This has been relatively in line with funding rate behavior elsewhere, and we continue to take comfort in the convergence to the broader market as a sign of maturation. The following summary statistics cover the largest dYdX Chain markets:
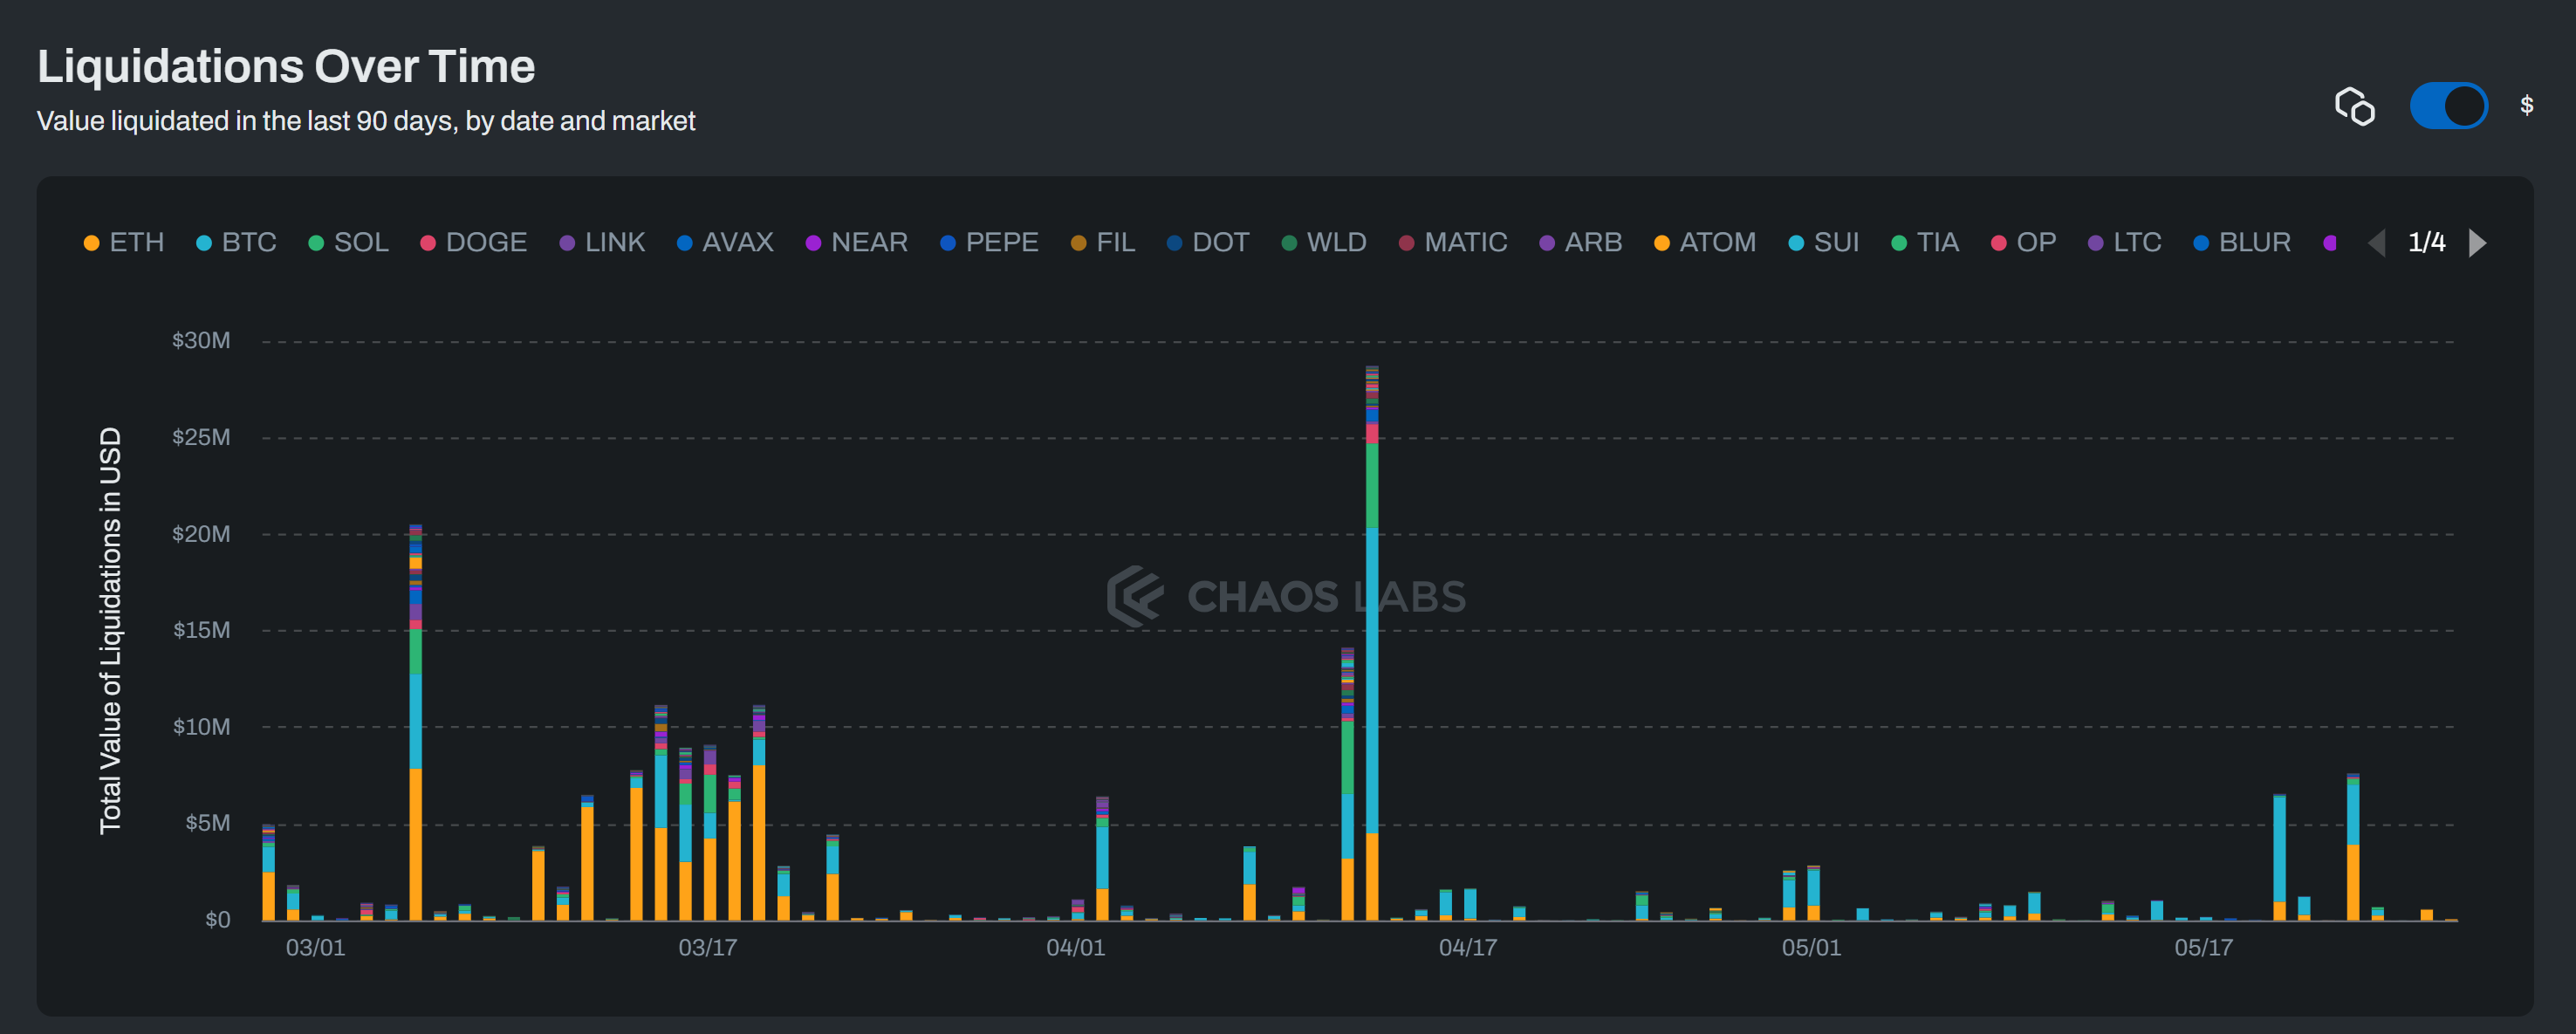
Liquidations
Lower volatility has resulted in muted liquidations over most of season 4. The main exception is April 13, with $28m liquidated.
The insurance fund now sits at over $5m, bootstrapped predominantly by protocol liquidation fees.
TVL and Deposit Metrics
USDC deposits continue to grow, providing a potential leading indicator to further growth in trading volumes.
At the end of Season 4, approximately 127m USDC was deposited on the dYdX Chain, up from 115m USDC at the start of the season.
Much room still exists to grow towards the approximately $340m TVL still in dYdX v3.
Program Efficiency Metrics
Much of the above analysis focuses on aggregate metrics, which can be influenced by a small number of traders. Our analysis of the program also encompasses a bottom-up assessment of the impact it has in growing the number of active traders.
This section provides a deep dive into trader-level metrics to highlight the program's impact across a range of dimensions. This, in turn, forms the basis for the long-term projections around the program’s impact and efficiency.
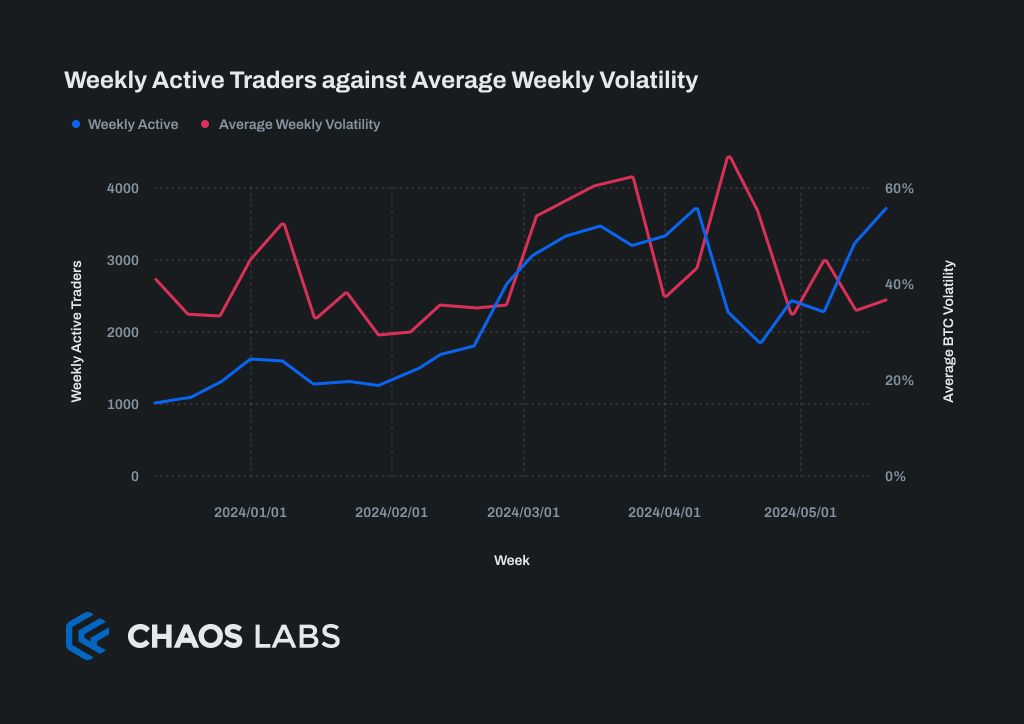
Daily and Weekly Active Traders
The number of weekly active traders has grown to a high of over 3243 last week. After an initial volatility-driven slowdown in weekly active traders, we have seen a recent surge despite only seeing a moderate uptick in volatility.
Growing the number of average daily and weekly active traders on dYdX is a guiding principle of the Launch Incentive Program, and significant care is taken to ensure that the incentives appeal to a diverse segment of traders.
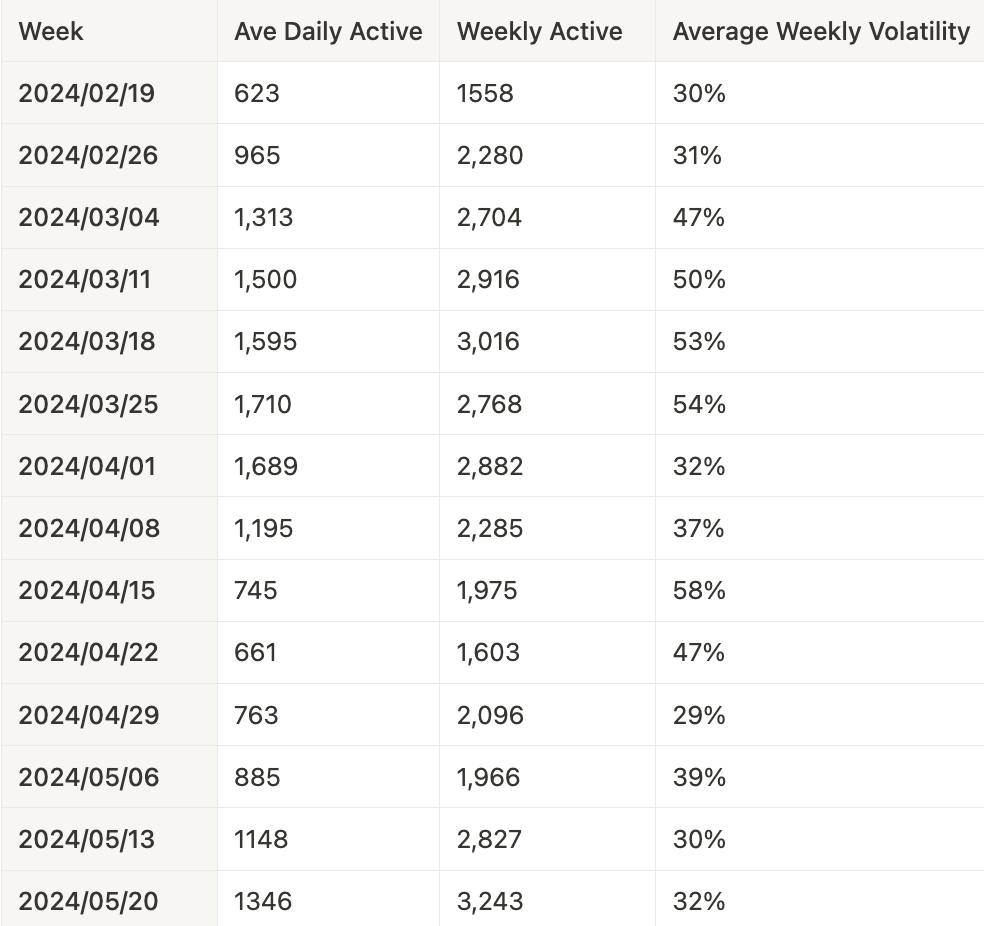
- Weekly active traders are defined as traders who make at least one trade during a week.
- Volatility is measured as the variance of minute-by-minute log returns of BTC. This short time frame accurately measures the volatility experienced by dYdX Chain traders in its largest market better than the traditional daily volatility.
Trader Engagement
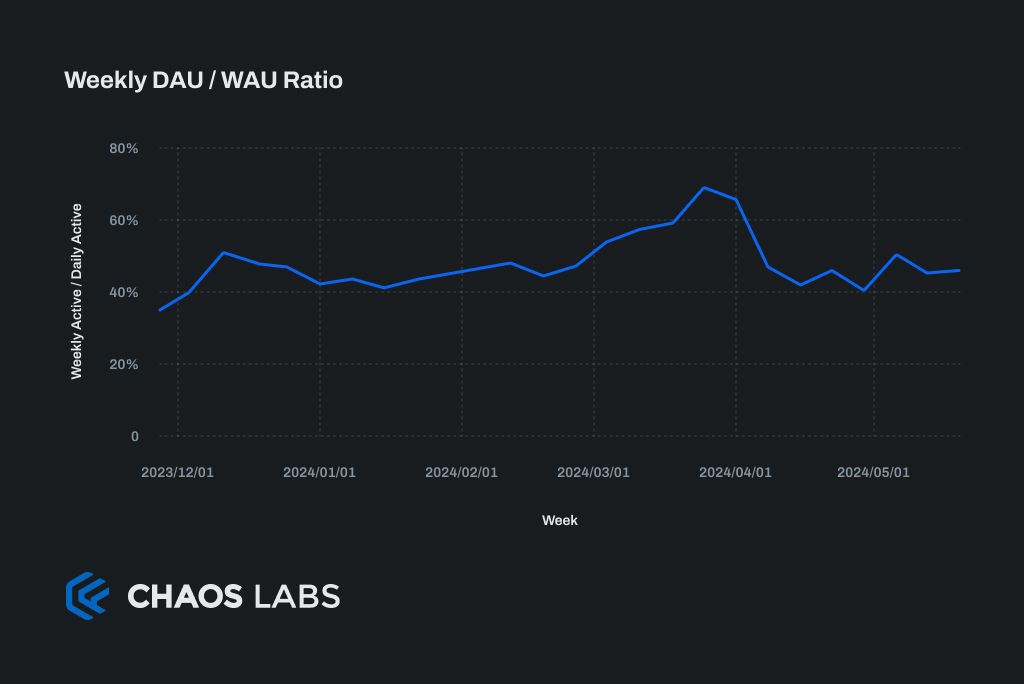
Trader engagement is defined as how frequently the active user interacts with the dYdX Chain. This is analyzed across a few dimensions. The ratio of average daily active users to weekly active users broadly signals what portion of weekly active traders make a trade on a given day in the week. When this ratio is high, more traders find value in the product and return for this utility.
From a Launch Incentive Program perspective, the incentives should appeal to traders who are likely to become more regular traders and, therefore, likely to be stickier over the long term.
This ratio remained steady between 38% and 45% during seasons 1 and 2. It increased throughout season 3, peaking at over 60% in late March when trading streaks were directly incentivized. This season, it has returned to its long-term average of 38% to 45%.
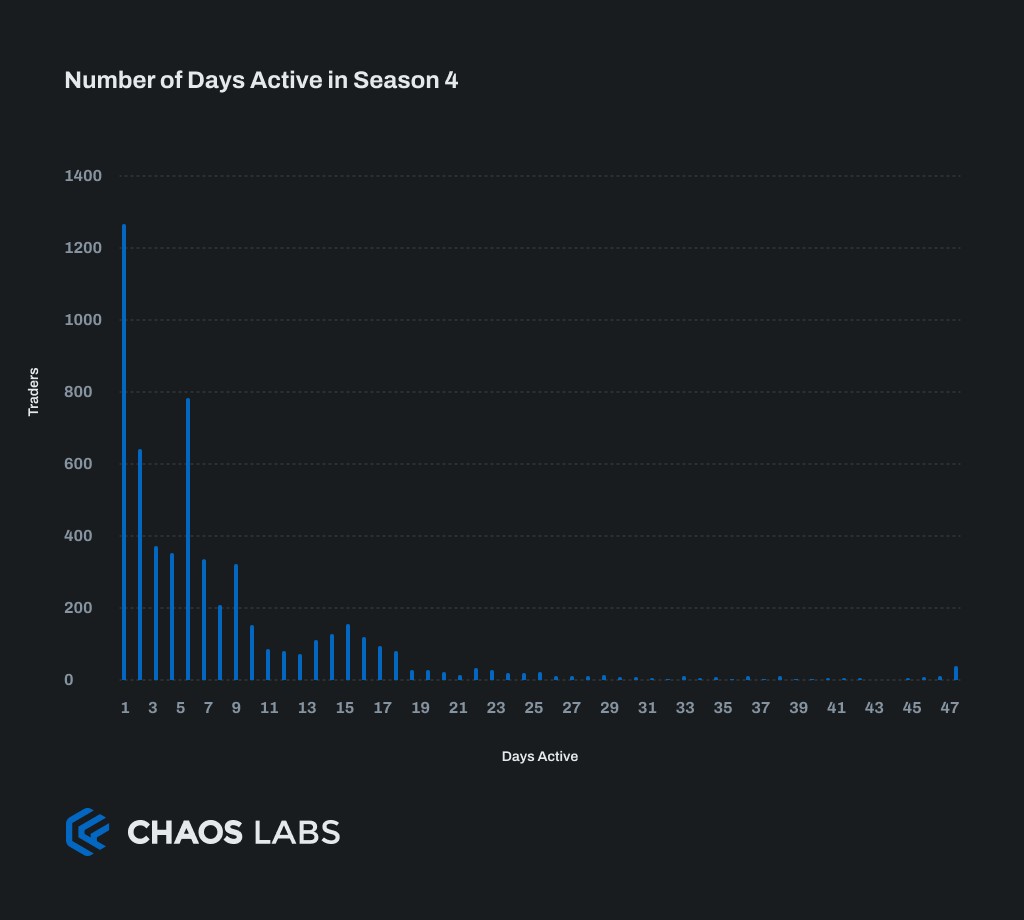
Another measure analyzed is the number of days traders have been active during season 4.
This long-tailed distribution is typical of trading exchanges. We take encouragement that only 21% of traders traded on a single day and 11% on two days. This is in line with the previous season and a significant further improvement on seasons 1 and 2. Most traders are trying out the dYdX Chain over multiple days, potentially aspiring to score well in one of the trading leagues.
Data on the number of days each trader has been active in season 3 drops off quickly from 1 day to 7 days before flattening out significantly. 17% of traders have traded on at least half the days this season. 50% have traded at least five times. These are also improvements on earlier seasons.
There have been 41 traders active every day this season so far, roughly in line with previous seasons. 325 traders, making up over 5% of the total, have been active on at least half the trading days in season 4.
Weekly Trader Breakdown and Retention
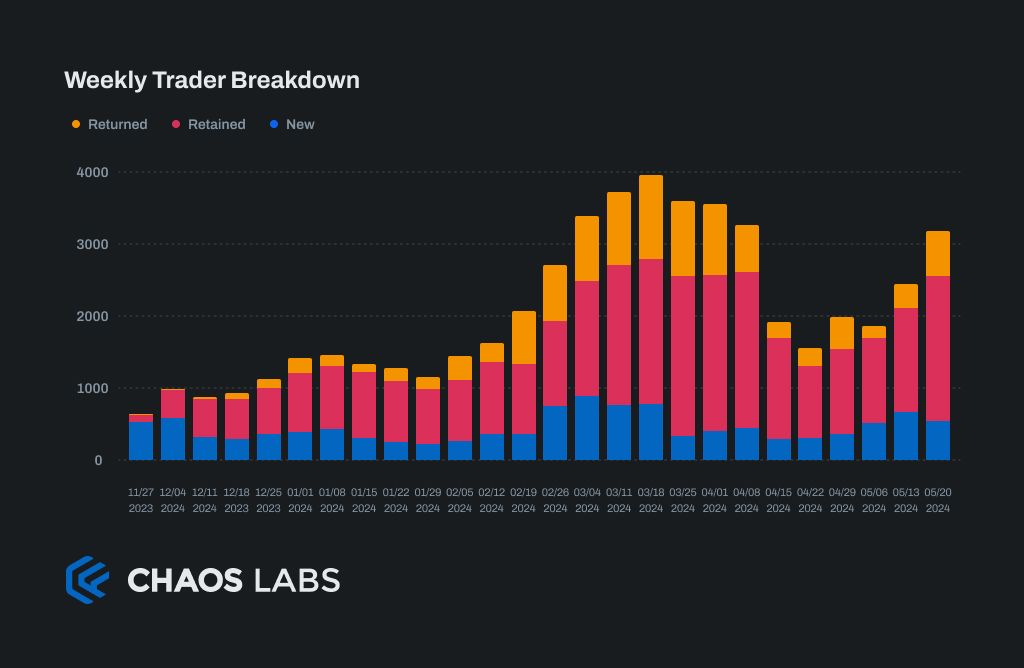
Initially, the total number of traders predictably dropped as a result of the end of the streak bonus from season 3, mainly in the retained and returning trader segments. The number of new traders trying out the dYdX Chain remains reasonably strong and is again accelerating as we near the end of the season.
The data indicates a segment of traders that trade on the exchange in volatile or otherwise interesting weeks, leaving on quieter weeks.
The nature of a trading exchange makes retention metrics challenging, as there can be cases of traders missing a week but remaining loyal users. To avoid mismeasurement of these traders as a churn (as one would in a SaaS business, for example) while retaining granular measurement of weekly behavioral trends, we separate retained traders (traded in the previous and current week) and returned traders (traded in at least one week prior to the previous, and the current week). This highlights the compounding nature of growing these engaged users as the base continues to grow with them due to their relatively lower churn than newer traders.
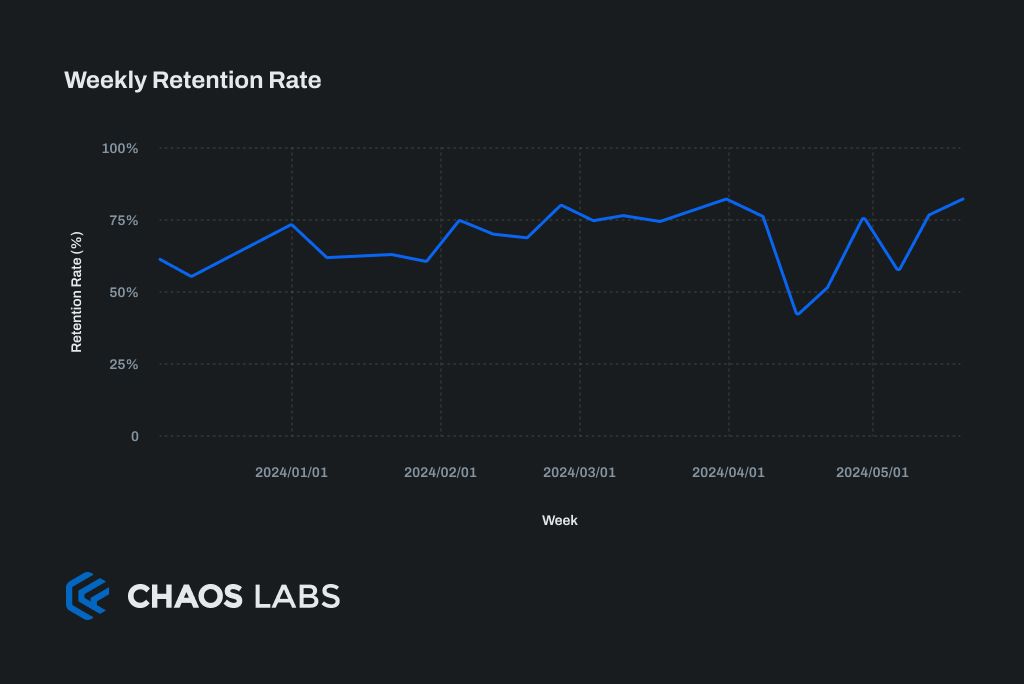
The weekly trader retention rate this season indicates that, over time, traders are becoming increasingly engaged with the dYdX Chain. The initial drop in the first week of the season can be attributed to the end of the streaks bonus, which provides a measure of the number of accounts created to target this. Retention has since recovered to the best levels recorded, 83%.
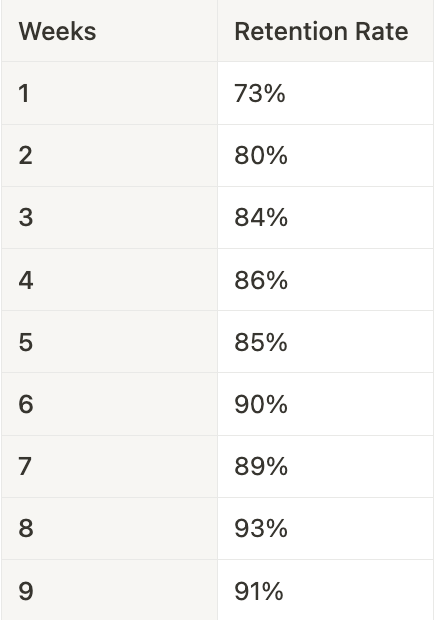
The marginal weekly trader retention rate shows how likely it is for a trader who has traded for a certain number of weeks to trade for one more. This is a slightly different methodology from the retention rate above, as returning traders are treated the same as retained traders here, hence the higher retention numbers.
What is apparent is how much better traders retain the more weeks they have been active. The goal is to get a trader active for at least six weeks, as the data suggests traders are incredibly sticky.
This also quantitatively represents what the Launch Incentive Program intends to achieve. Bring traders on board who come from the rewards but end up staying for the utility of the dYdX Chain.
Marginal Weekly Trader Retention Rate
Summary
There are many aspects contributing to the growth in the dYdX Chain since the Launch Incentive Program began. Attributing growth to specific factors is not an exact science, and we acknowledge the impact market conditions have on trading activity. Given that, here are some highlights from our analysis:
- Stakers have earned over $8.3m in fees during season 4, and the program will pay out $5m in rewards.
- Over 5500 traders used dYdX Chain during season 4.
- Retention rates are trending higher each season.
- Traders who trade for 6 weeks or more retain at over 90%. The impact of trader acquisition from the rewards will be felt long after the program ends.
Disclaimer
This report is for informational purposes only and does not constitute an offer to sell, a solicitation to buy, or a recommendation for any security, nor does it constitute an offer to provide investment advisory or other services by Chaos Labs. No reference to any specific security constitutes a recommendation to buy, sell, or hold that security or any additional security. Nothing in this report shall be considered a solicitation or offer to buy or sell any security, future, option, or other financial instrument or offer or provide investment advice or service to any person in any jurisdiction. Nothing contained in this report constitutes investment advice or offers any opinion with respect to the suitability of any security, and the views expressed in this report should not be taken as advice to buy, sell, or hold any security. The information in this report should not be relied upon for investing. In preparing the information in this report, we have not considered any particular investor's investment needs, objectives, and financial circumstances. This information has no regard for the specific investment objectives, financial situation, and particular needs of any specific recipient of this information, and the investments discussed may not be suitable for all investors. Any views expressed in this report were prepared based on the data available when such views were written. Changed or additional information could cause such views to change. All information is subject to possible correction. Information may quickly become unreliable, including market or economic changes.
Throughout the program, Chaos Labs' role is confined to providing recommendations regarding the allocation of rewards. The actual implementation and distribution of said rewards are subject to the formal approval process of the dYdX Chain governance votes. Any actions pertaining to reward distribution shall only be executed following affirmative governance votes within the dYdX Chain framework.
Arbitrum STIP Risk Analysis | Case Study #2: Silo Finance
Chaos Labs is pleased to share a blog post detailing our second case study for the Arbitrum Research & Development Committee (ARDC): Silo Finance. This is the second case study of a three-part series that entails an in-depth analysis of the risk and efficiency of the Arbitrum STIP on three major protocols, the second of which is Silo Finance. As requested by the DAO advocate for the ARDC, L2BEAT, Chaos Labs has been conducting case studies on STIP recipients. This case study provides an in-depth analysis of the Arbitrum STIP program’s impact on Silo Finance, focusing on its efficiency and associated risks. This analysis is part of a broader series that evaluates the STIP program across three major protocols.
Arbitrum STIP Risk Analysis | Case Study #1: Vertex
As part of our recent election as the Risk Member on the Arbitrum Research & Development Committee (ARDC), Chaos Labs is excited to share a blog post detailing our first case study for the ARDC: Vertex. This is the first case study of a three-part series that entails an in-depth analysis of the risk and efficiency of the Arbitrum STIP on three major protocols, the first of which is Vertex. As requested by the DAO advocate for the ARDC, L2BEAT, Chaos Labs has begun conducting case studies on STIP recipients. This case study provides an in-depth analysis of the Arbitrum STIP program’s impact on the Vertex Protocol, focusing on its efficiency and associated risks. This analysis is part of a broader series that evaluates the STIP program across three major protocols. We will begin by introducing the STIP program and giving an overview of Vertex, followed by our team's full case study.
Risk Less.
Know More.
Get updates on our research, product, and launch.