Yield as a Risk Signal: Part II
- Introduction
- Risks Through Data and Events
- 2.1 Drawdowns: The Cost of Accessing Edge
- 2.2 Underwater Duration: How Long Below ATH?
- 2.3 APY vs. Realized Path
- 2.4 Risk-Adjusted Returns vs. Path Risk
- 2.5 Tail Risk: Manipulation & Rollbacks
- Comparative Analysis
- 3.1 Positioning MM Vaults on the Cash-to-Risk Spectrum
- Conclusion: Takeaways for Allocators
- 4.1 MM Vaults as Risk Assets With Structural Edge
Introduction
In Part 1, we introduced a simple idea: yield is a risk signal.
If an MM vault pays an attractive APY, it does so because the depositor is underwriting a specific and non-trivial set of risks.
We also made two core claims about MM vaults on perp DEXs:
- They should not be treated as cash, since the path to edge is non-linear
- The “house edge” is never a guarantee. It depends on market structure + how the vault’s MM’ing logic performs relative to others.
In this piece, we put data behind these claims. Rather than discussing MM vaults in the abstract, we examine how these vaults have behaved over time, with a focus on:
- Hyperliquid’s HLP
- Lighter’s LLP
- Paradex’s Gigavault
- Ostium’s oLP
For each product, we analyze max drawdowns, time spent underwater relative to previous ATHs, daily return volatility, distributions, and compare realized 30-day yields to the marketed APYs.
The objective is not to “rank” these protocols or issue a risk verdict on any vault. Rather, we run a data-driven sanity check on the narratives that have grown around these products (delta-neutral, low risk, cash-like, the house always wins) and and assess whether allocators have been compensated for the risk they've actually taken.
With this framework in mind, we begin with the most tangible expression of risk for a depositor: drawdowns and path, i.e., what happens if capital is deployed at the wrong time and how long it takes to recover.
Risks Through Data and Events
2.1 Drawdowns: The Cost of Accessing Edge
The cleanest way to sanity-check the “cash-like” narrative is to examine max drawdown: the worst peak-to-trough loss a depositor would have experienced over the observed history. Treating a vault as cash implicitly assumes this number should be close to zero over any reasonable window.
Here’s what we find across the four vaults:
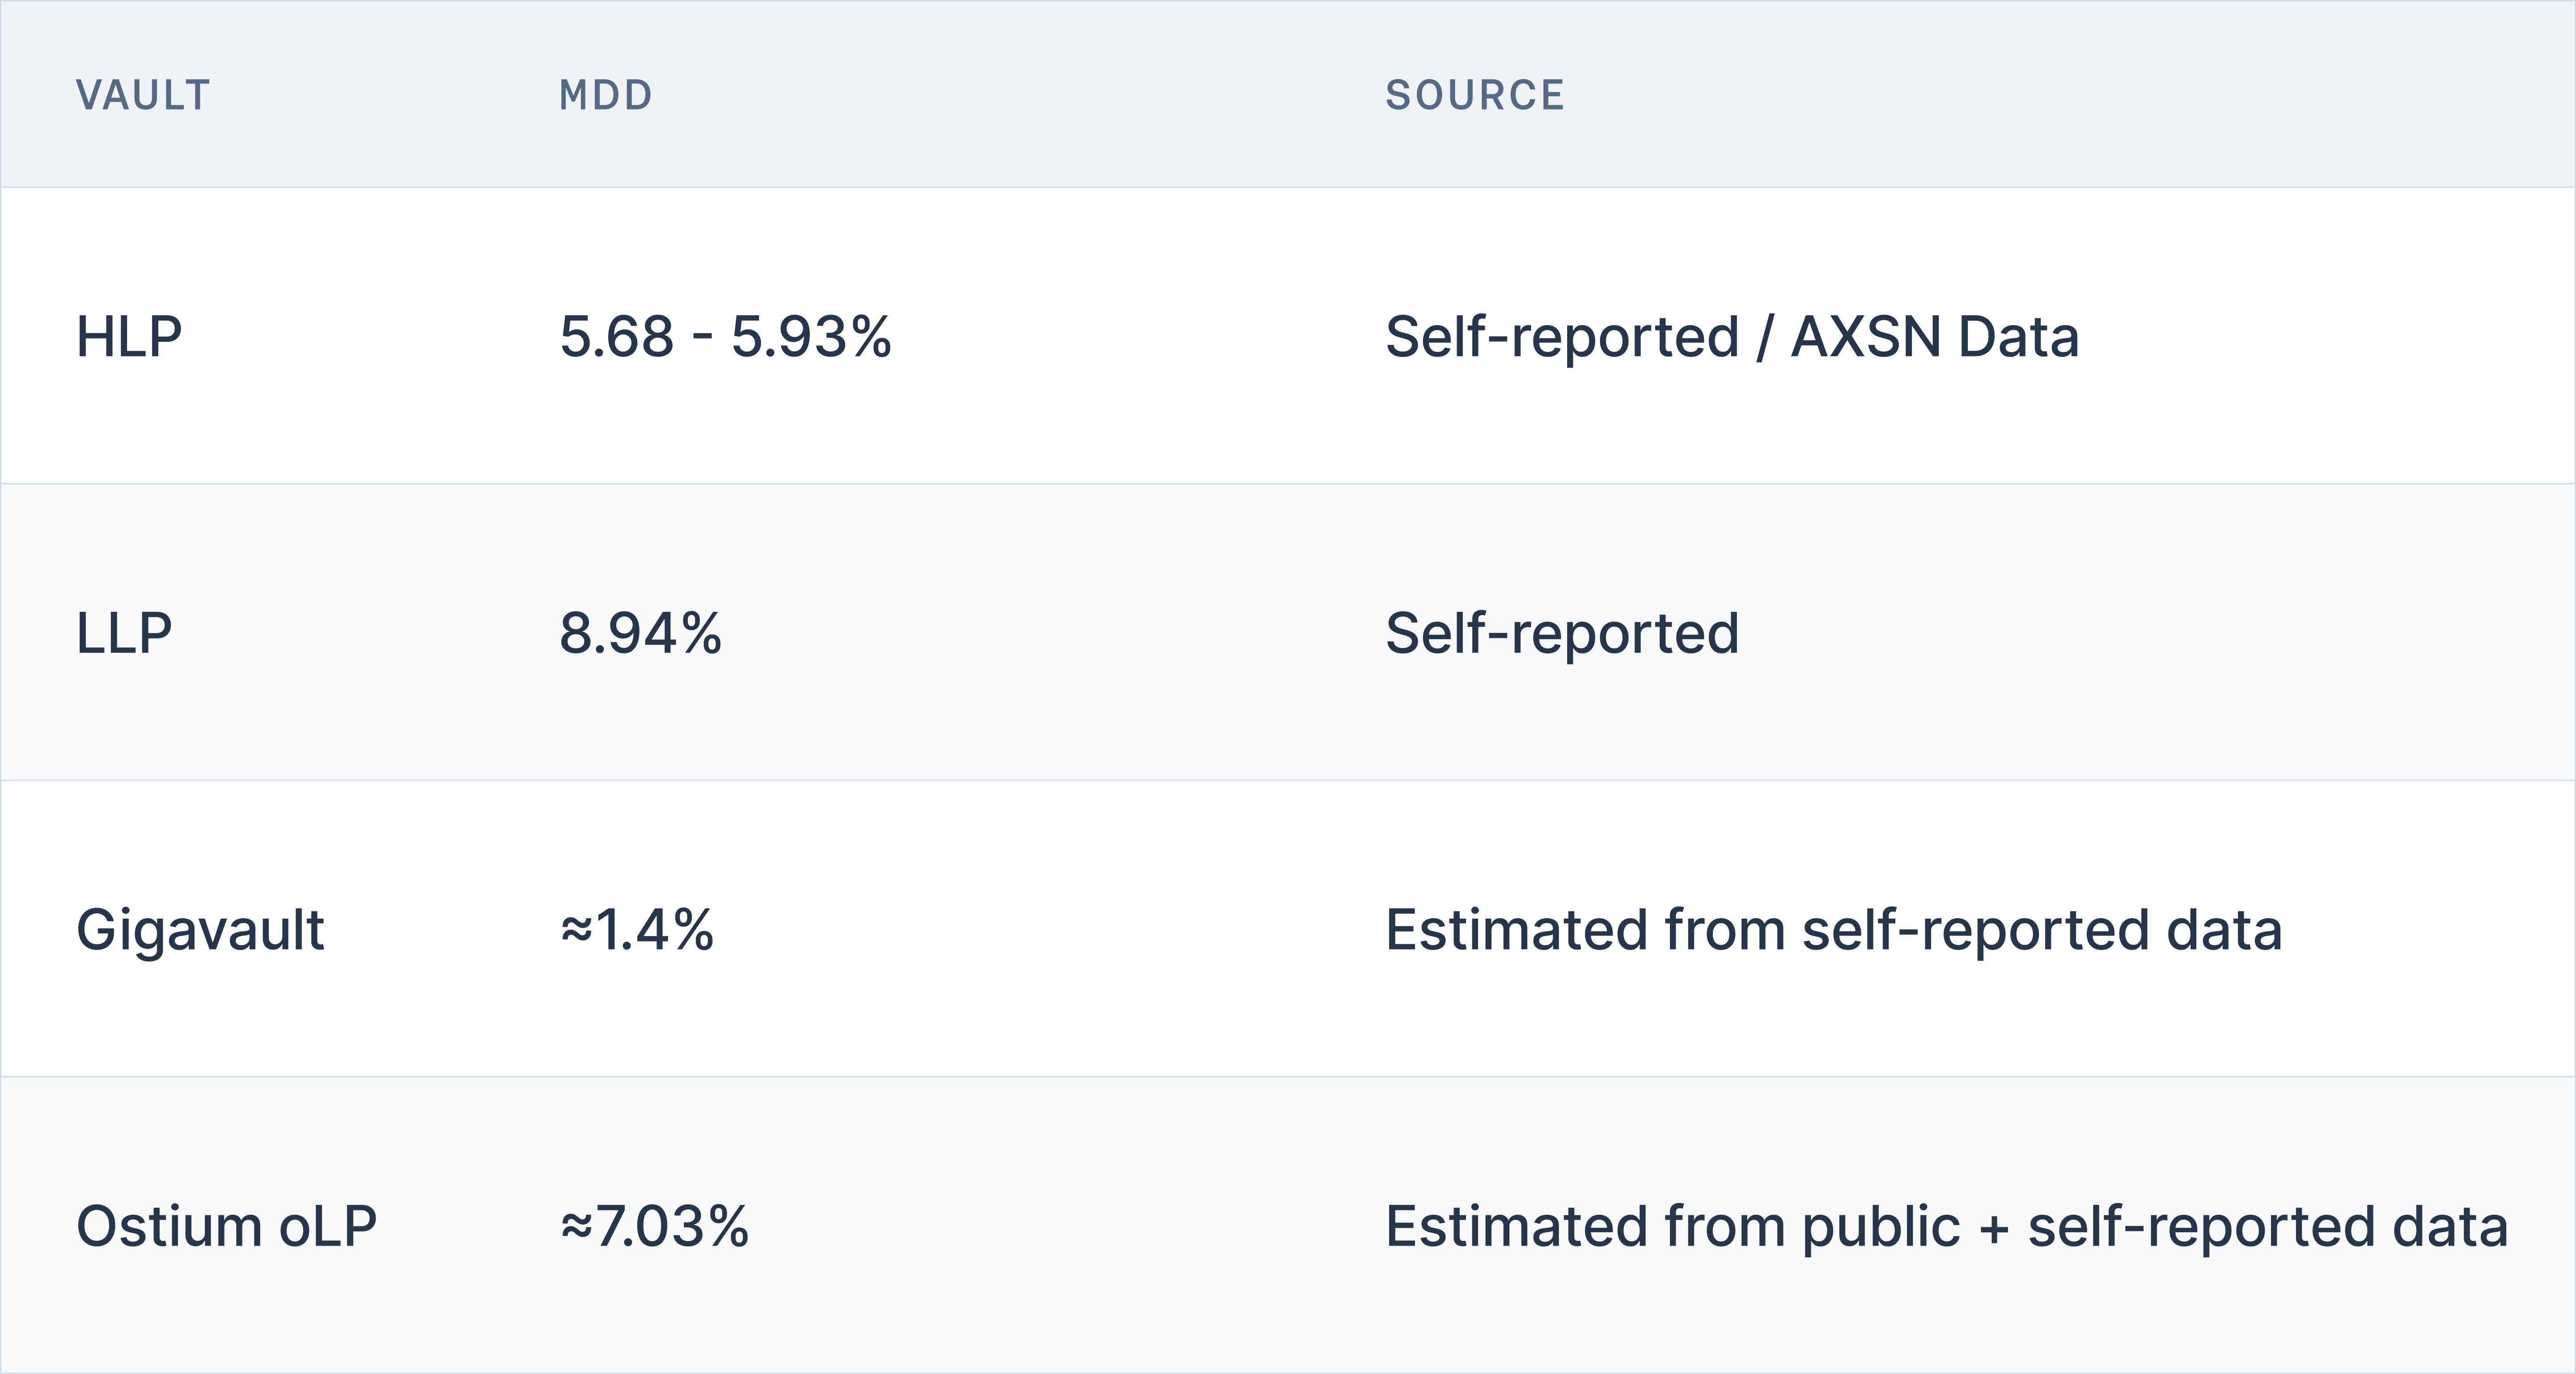
Some points are immediately clear:
- These vaults do not behave like cash. A 5-9% drawdown for HLP, LLP, and oLP (and ~1.4% for Gigavault) may be acceptable for a trade, but not for capital you might need on short notice.
- Even the “safest-looking” vault shows signs of a measurable drawdown, proving our core point. MM vaults have these drawdowns because that is the cost of accessing their edge.
- Differences between the vaults are real but not directly comparable. Data sources, methodologies, and time windows vary.
2.2 Underwater Duration: How Long Below ATH?
If maximum drawdown captures magnitude, underwater time captures lived experience.
It reflects how long a user needs to wait before reaching the previous ATH. Based on a mix of self-reported and public data, the underwater timelines for these four vaults are as follows:
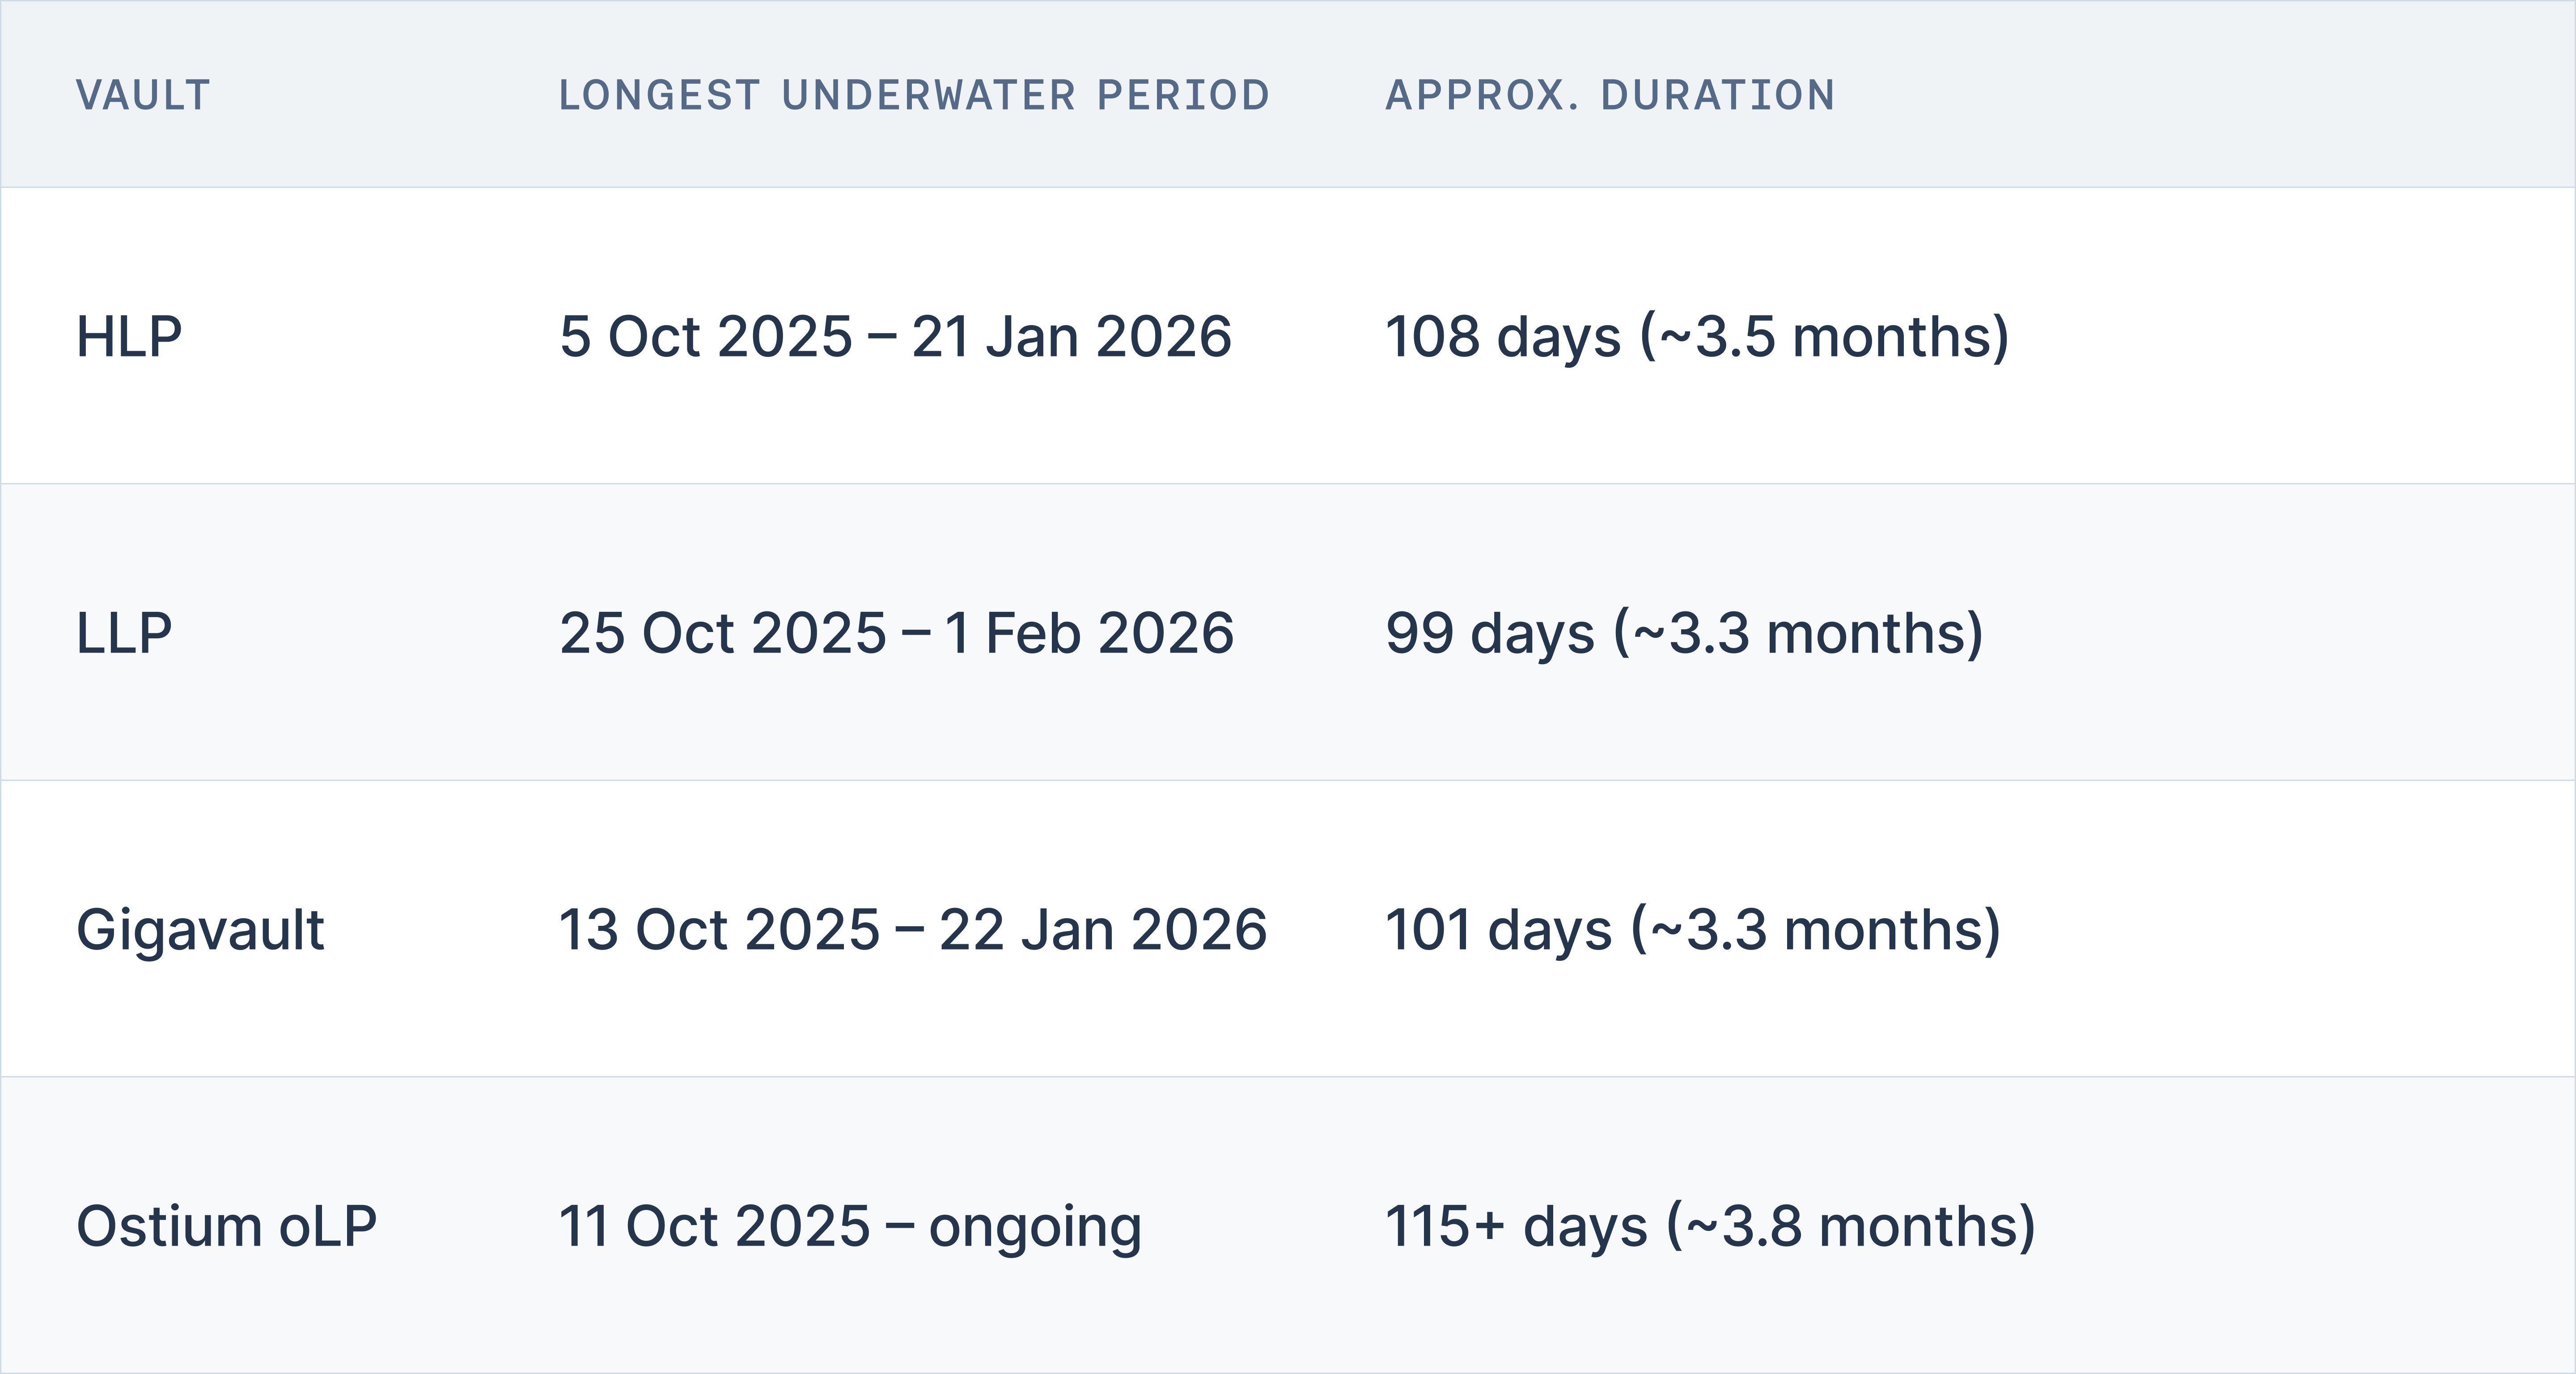
Conclusion: even vaults with strong long-term performance can spend months underwater if the timing is wrong. Again, this is acceptable for users with multi-month time and risk horizons but fundamentally incompatible as cash accounts expected to redeem at par.
Another important note.
These underwater periods all begin around the 10/10/2025 market shock, when volatility spiked and there was significant stress across perp markets. A key distinction: unlike cash, MM vaults have real market exposure and they tend to be severely impacted precisely when markets are under stress:
- Directional bull markets: trader profitability can push MM vaults into drawdown
- In sharp volatility shocks and liquidation cascades: Inventory risk, funding dynamics, and liquidation mechanics can all turn against the vault simultaneously
From a depositor’s perspective, this means MM vaults cannot be relied on as “dry powder” during periods of market dislocations.
2.3 APY vs. Realized Path
Lighter provides the most complete public dataset, with LLP exposing a full daily performance history. Over the last four months, LLP recorded 108 positive days and 15 negative days, with an ~88% hit rate.
- On most days, returns are a few basis points
- On roughly 18% of days, yield is effectively flat
- On adverse days (e.g. 10/10), losses can erase multiple days or weeks of accumulated gains
For example, the –5.35% drop on 11 October reversed weeks of steady yield compounding.
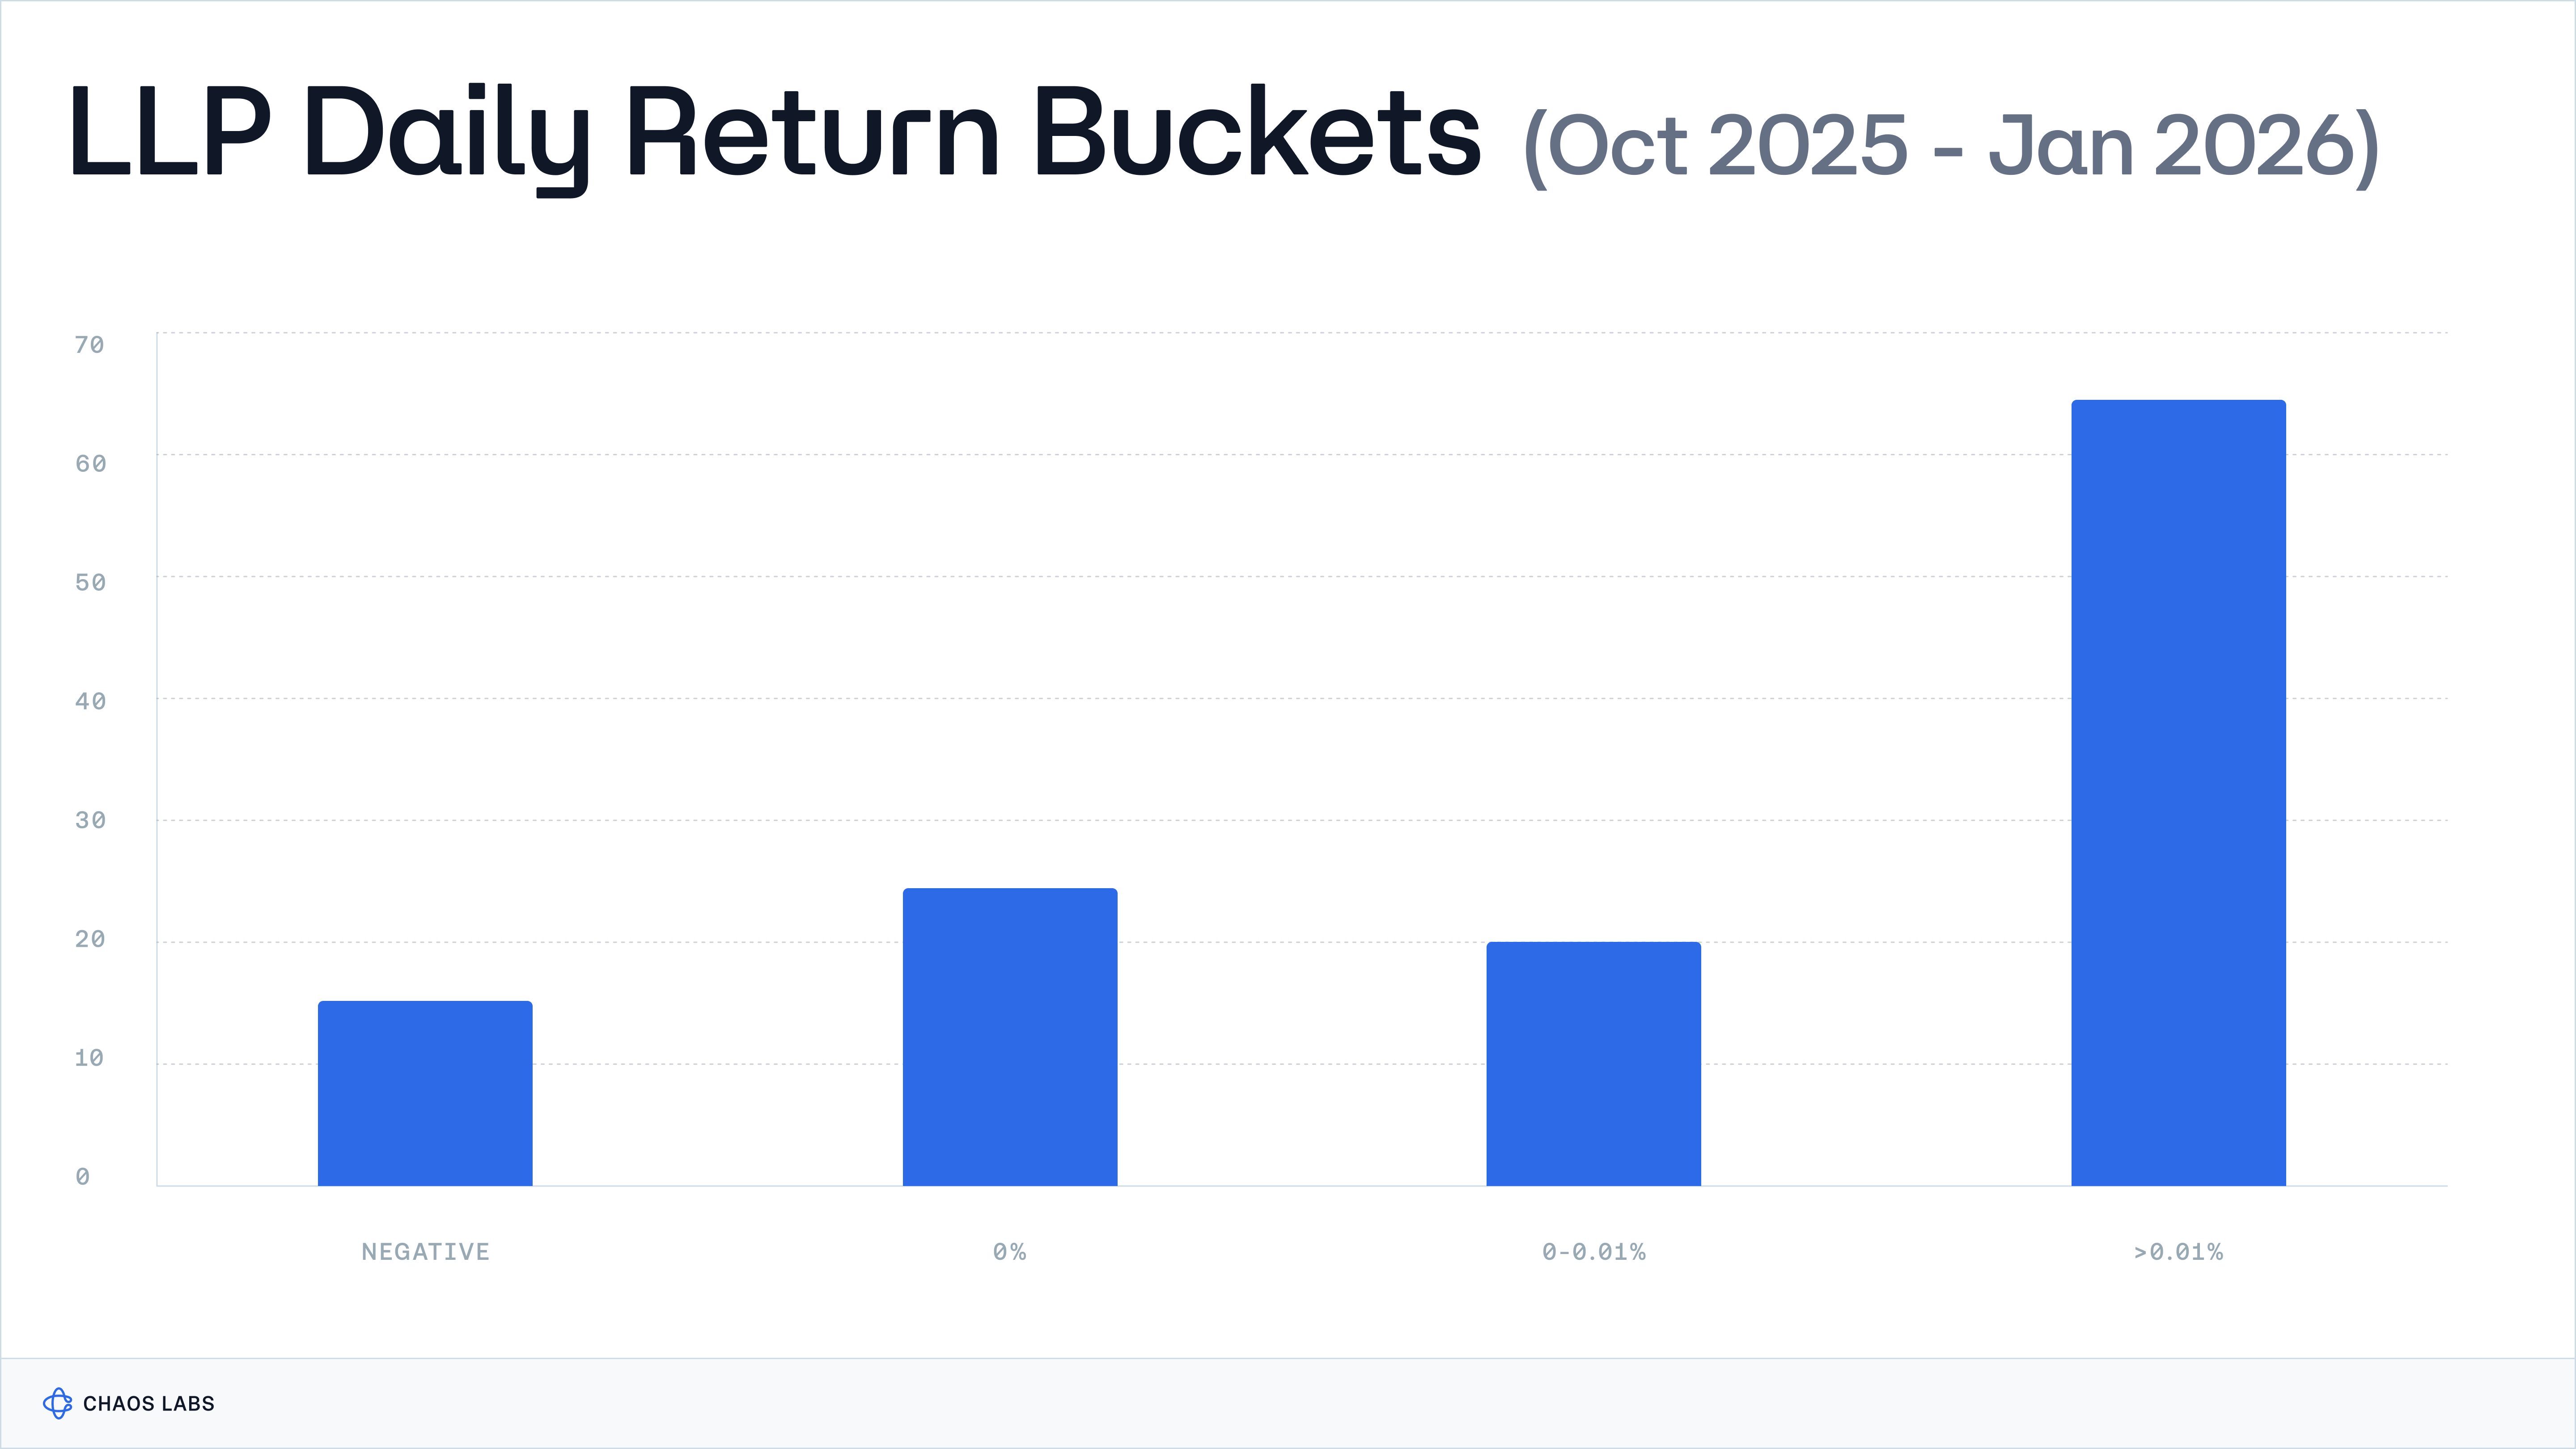
A key point for allocators to note: MM yield accrues along this “lumpy” path.
The marketed APYs are a backward-looking annualization of recent outcomes over a specific distribution. After a month like December (30 green days, almost no drawdowns), the quoted APY tends to attract deposits. If conditions subsequently normalize, realized performance can lag expectations, particularly as TVL grows and marginal edge compresses.
Overall, the initial period of life of each LP Vault sees a lumpier path, with higher volatility, due to higher relative metrics compared to TVL and often also induced by the “airdrop hunting” activity. As the platforms mature, yield typically becomes a lot smoother but also more muted.
2.4 Risk-Adjusted Returns vs. Path Risk
So far we’ve established that perp DEX MM vaults are not cash; however, it’s important to note that when viewed correctly they could be attractive avenues for yield.
- Lighter’s LLP currently self-reports a Sharpe of 4.71 with readings as high as 6.97 during its early life.
- ASXN estimates a Sharpe of 2.89 for Hyperliquid’s HLP on a since-inception basis, down from 5.45 in early 2025.
- Both vaults show a similar average daily return of ~0.23% (LLP self-reported, HLP from ASXN data).
These Sharpe ratios are strong relative to most risk assets and are certainly higher than stablecoin lending or cash substitutes. Two caveats to highlight against this point:
- Early-life skew. Since inception Sharpe is front-loaded. In the first months of launch, TVL is much lower, volume tends to be dominated by airdrop hunters and each trade is significantly reflected on the NAV. This mix can produce lumpy but generous early returns and subsequently push Sharpe into the 5–7 range. As TVL and volumes grow and conditions normalise, returns usually flatten and compress, and lifetime Sharpe drifts down.
- Sharpe ≠ cash. Strong risk-adjusted returns do not eliminate drawdowns, months underwater, or tail risk. A vault can highlight above average Sharpe and still be unsuitable for capital that is required at short notice.
2.5 Tail Risk: Manipulation & Rollbacks
So far all the metrics we’ve highlighted in this piece (drawdowns, volatility, Sharpe) describe normal-regime risk, i.e., what happens when the venue works as designed. However, MM vault allocators also face venue-level tail risks, which occur when the vault ceases to be the house and becomes the backstop for structural failures and/or manipulation.
2.5.1. Hyperliquid: When LPs Become the Backstop
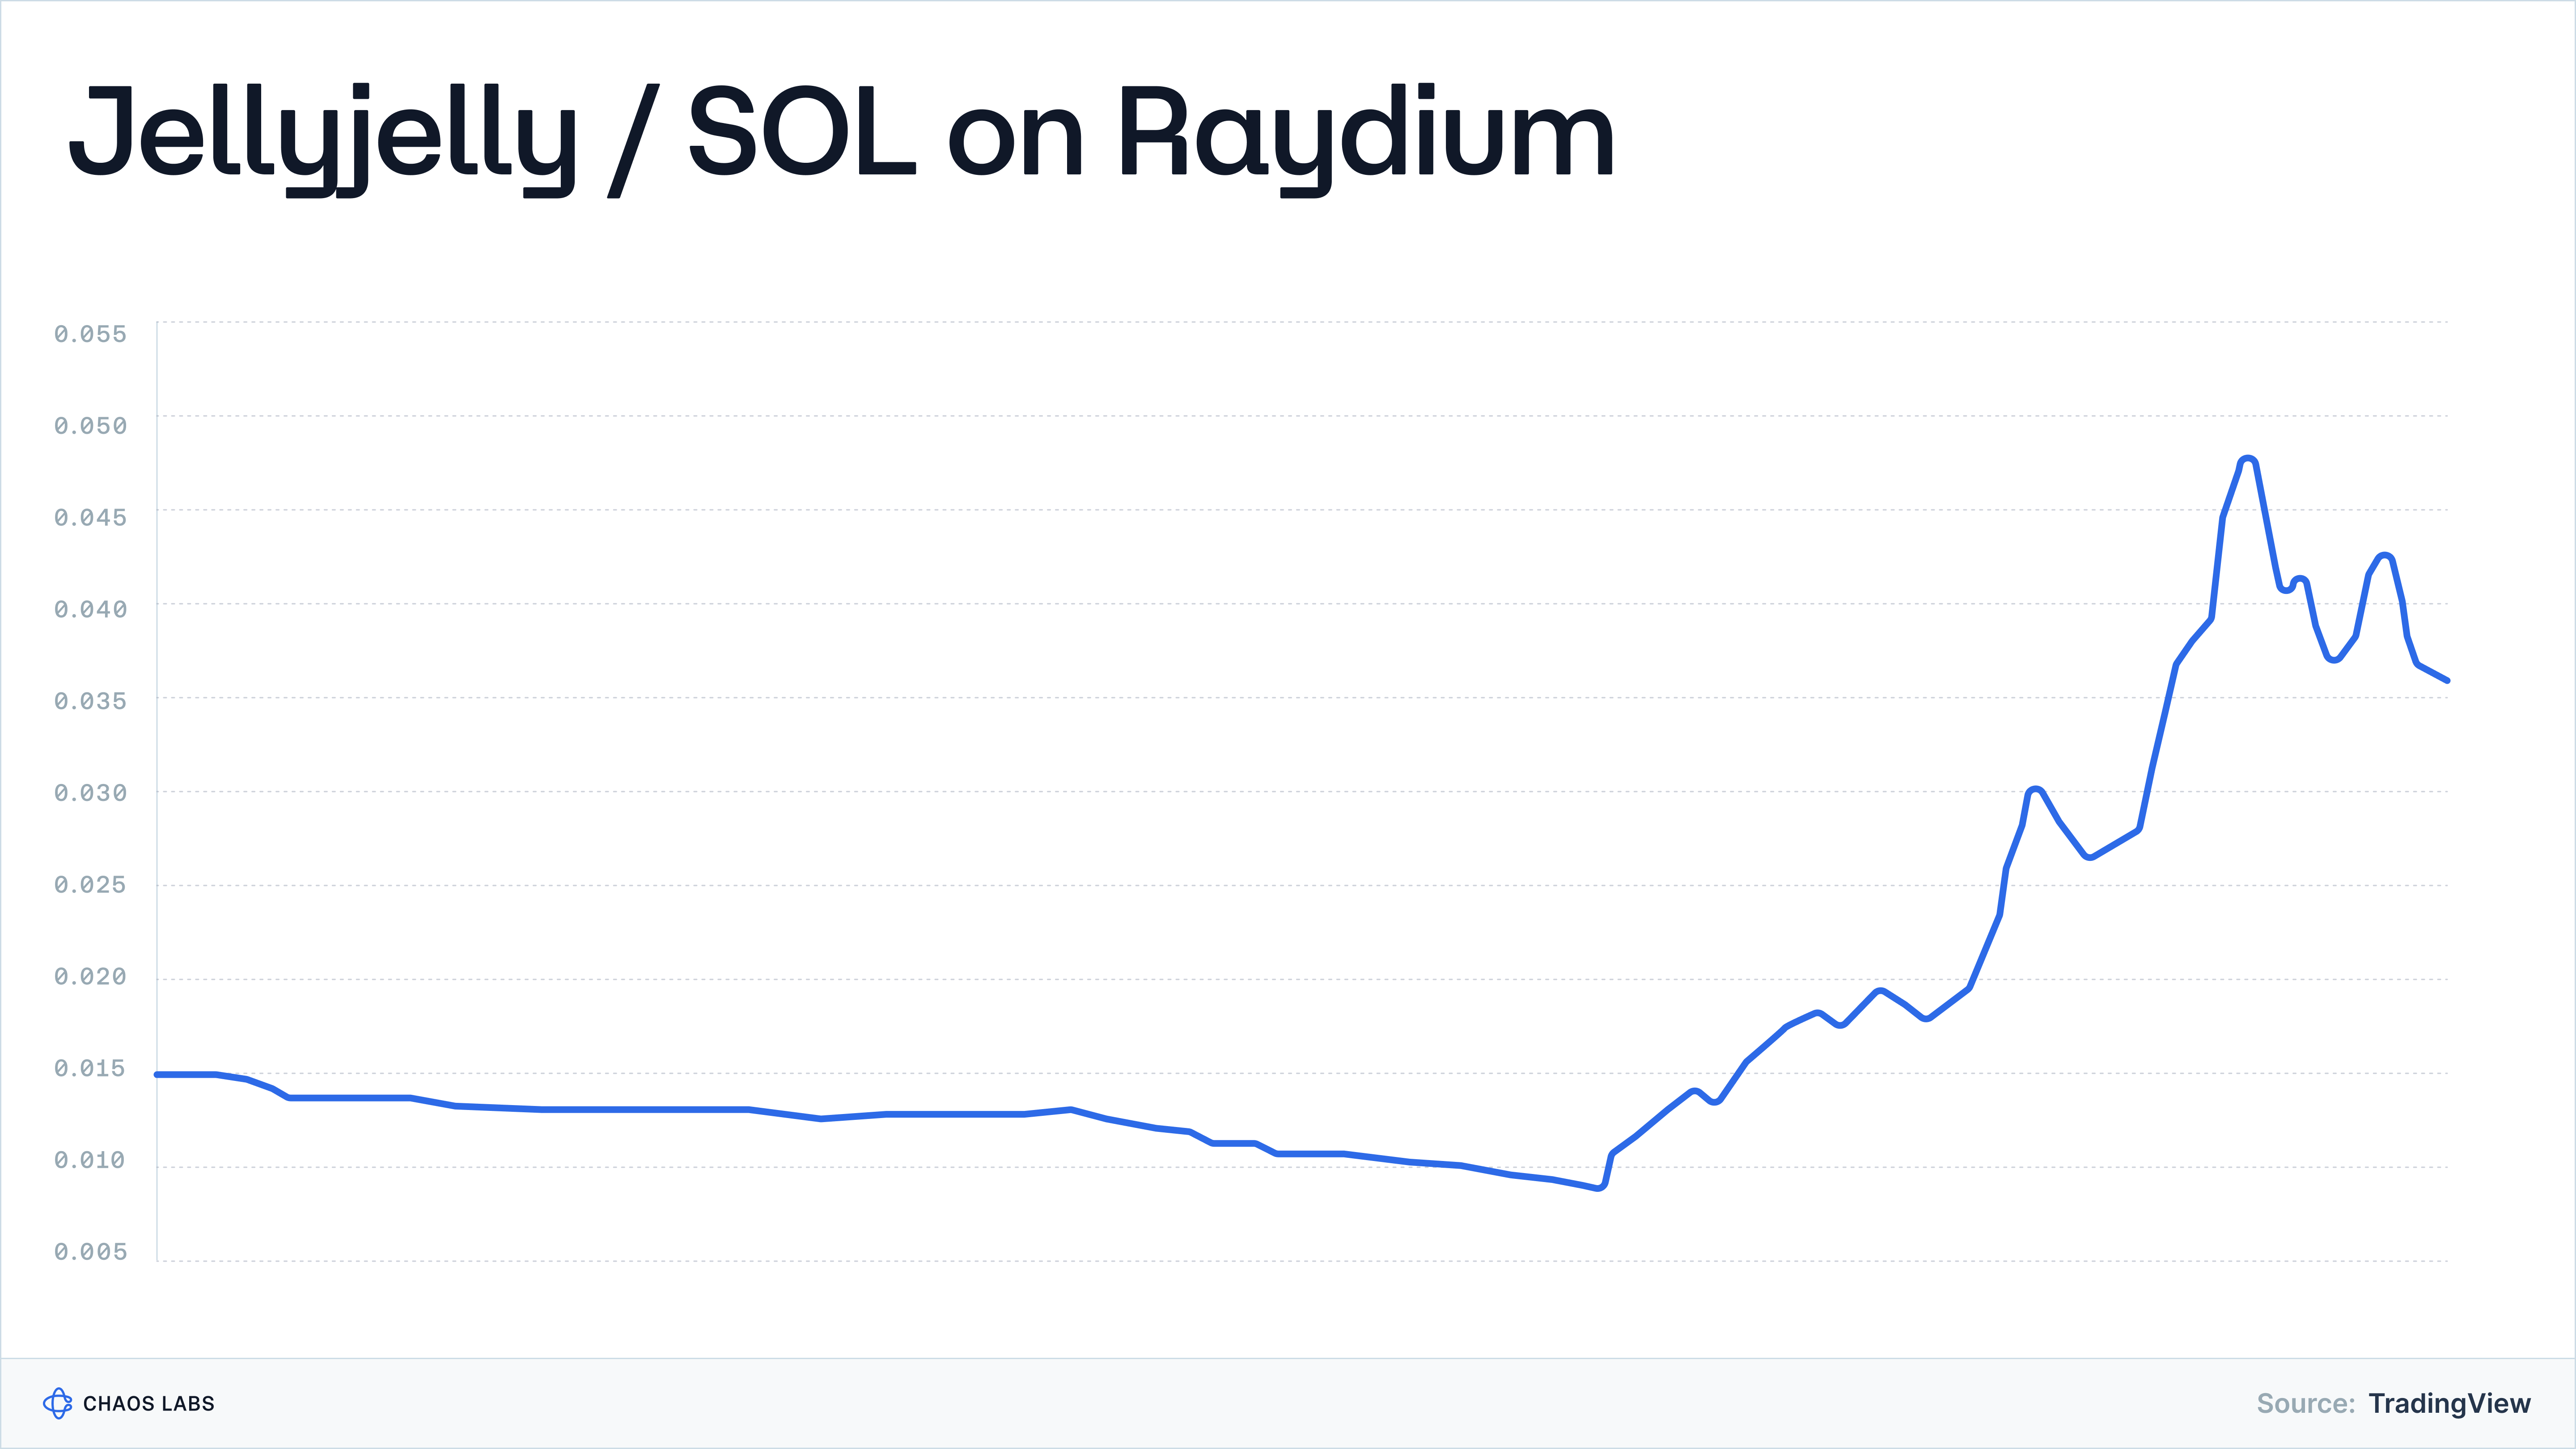
In March 2025, Hyperliquid’s HLP vault was at the center of the now-infamous JELLYJELLY incident.
A trader used a thin, highly manipulable listing to game the liquidation system by aggressively pumping JELLYJELLY’s price, forcing a cascade of liquidations, and then pushing a large, deeply underwater position into the HLP vault. At peak stress, the vault was sitting on an eight-figure unrealised loss and there were scenarios where a further move could have wiped out a significant portion of LP capital.
At that point, the team intervened by force-closing positions and delisting the market, effectively overriding price discovery to prevent a solvency event. This episode exposed three non-obvious risks for HLP depositors:
listing risk on thin memecoins, mechanism risk in the liquidation engine (or handling of risk parameters), and governance discretion in how these events are handled.
A similar pattern occurred later in 2025 with POPCAT.
A trader withdrew a few million dollars from a CEX, split it across multiple wallets, levered long POPCAT on Hyperliquid, and then nuked the price. This coordinated activity generated millions in bad debt that again landed on HLP’s balance sheet. In the process, Hyperliquid temporarily paused deposits and withdrawals on its bridge while assessing the loss.
The takeaway for allocators is clear: sophisticated actors can manufacture tail risk by exploiting venue mechanics and then pushing residual losses to LPs. In essence, users are not just underwriting “market noise,” but also edge cases in the matching, liquidation, and listing stack.
2.5.2 Paradex: Infrastructure Risks
In January 2026, a database migration error corrupted price data on the Paradex Chain.
For a brief window, Bitcoin perps on the platform printed at or near zero, triggering mass liquidations across thousands of leveraged positions before prices snapped back.
To unwind the damage, Paradex rolled the chain back to an earlier block height, cancelled many affected orders and positions, and later announced refunds of ~$650k to roughly 200 users. From a user-P&L perspective, this was a relatively negligible outcome since balances were largely restored.
From a risk perspective, it is a stark reminder that “onchain finality” can be reversed if the venue deems it necessary and a single operational bug can unwind markets and, in extreme cases, threaten insurance funds and LP capital.
Taken together, the drawdown profile, underwater timeline, lumpy daily PnL, Sharpe, and black-swan episodes all point to the same conclusion: MM vaults are risk assets with a structural edge, and should not be considered “stable cash wrappers.”
3. Where MM Vaults Sit on the Risk Spectrum
In this section, we compare perp MM LP vaults alongside other products that DeFi users commonly treat as “cash” or “cash+”: USDC, t-bill wrappers such as USDtb, AaveUSDC, synthetic dollars like sUSDe.
We evaluate each along three dimensions: principal volatility, yield volatility, and liquidity or redeemability.
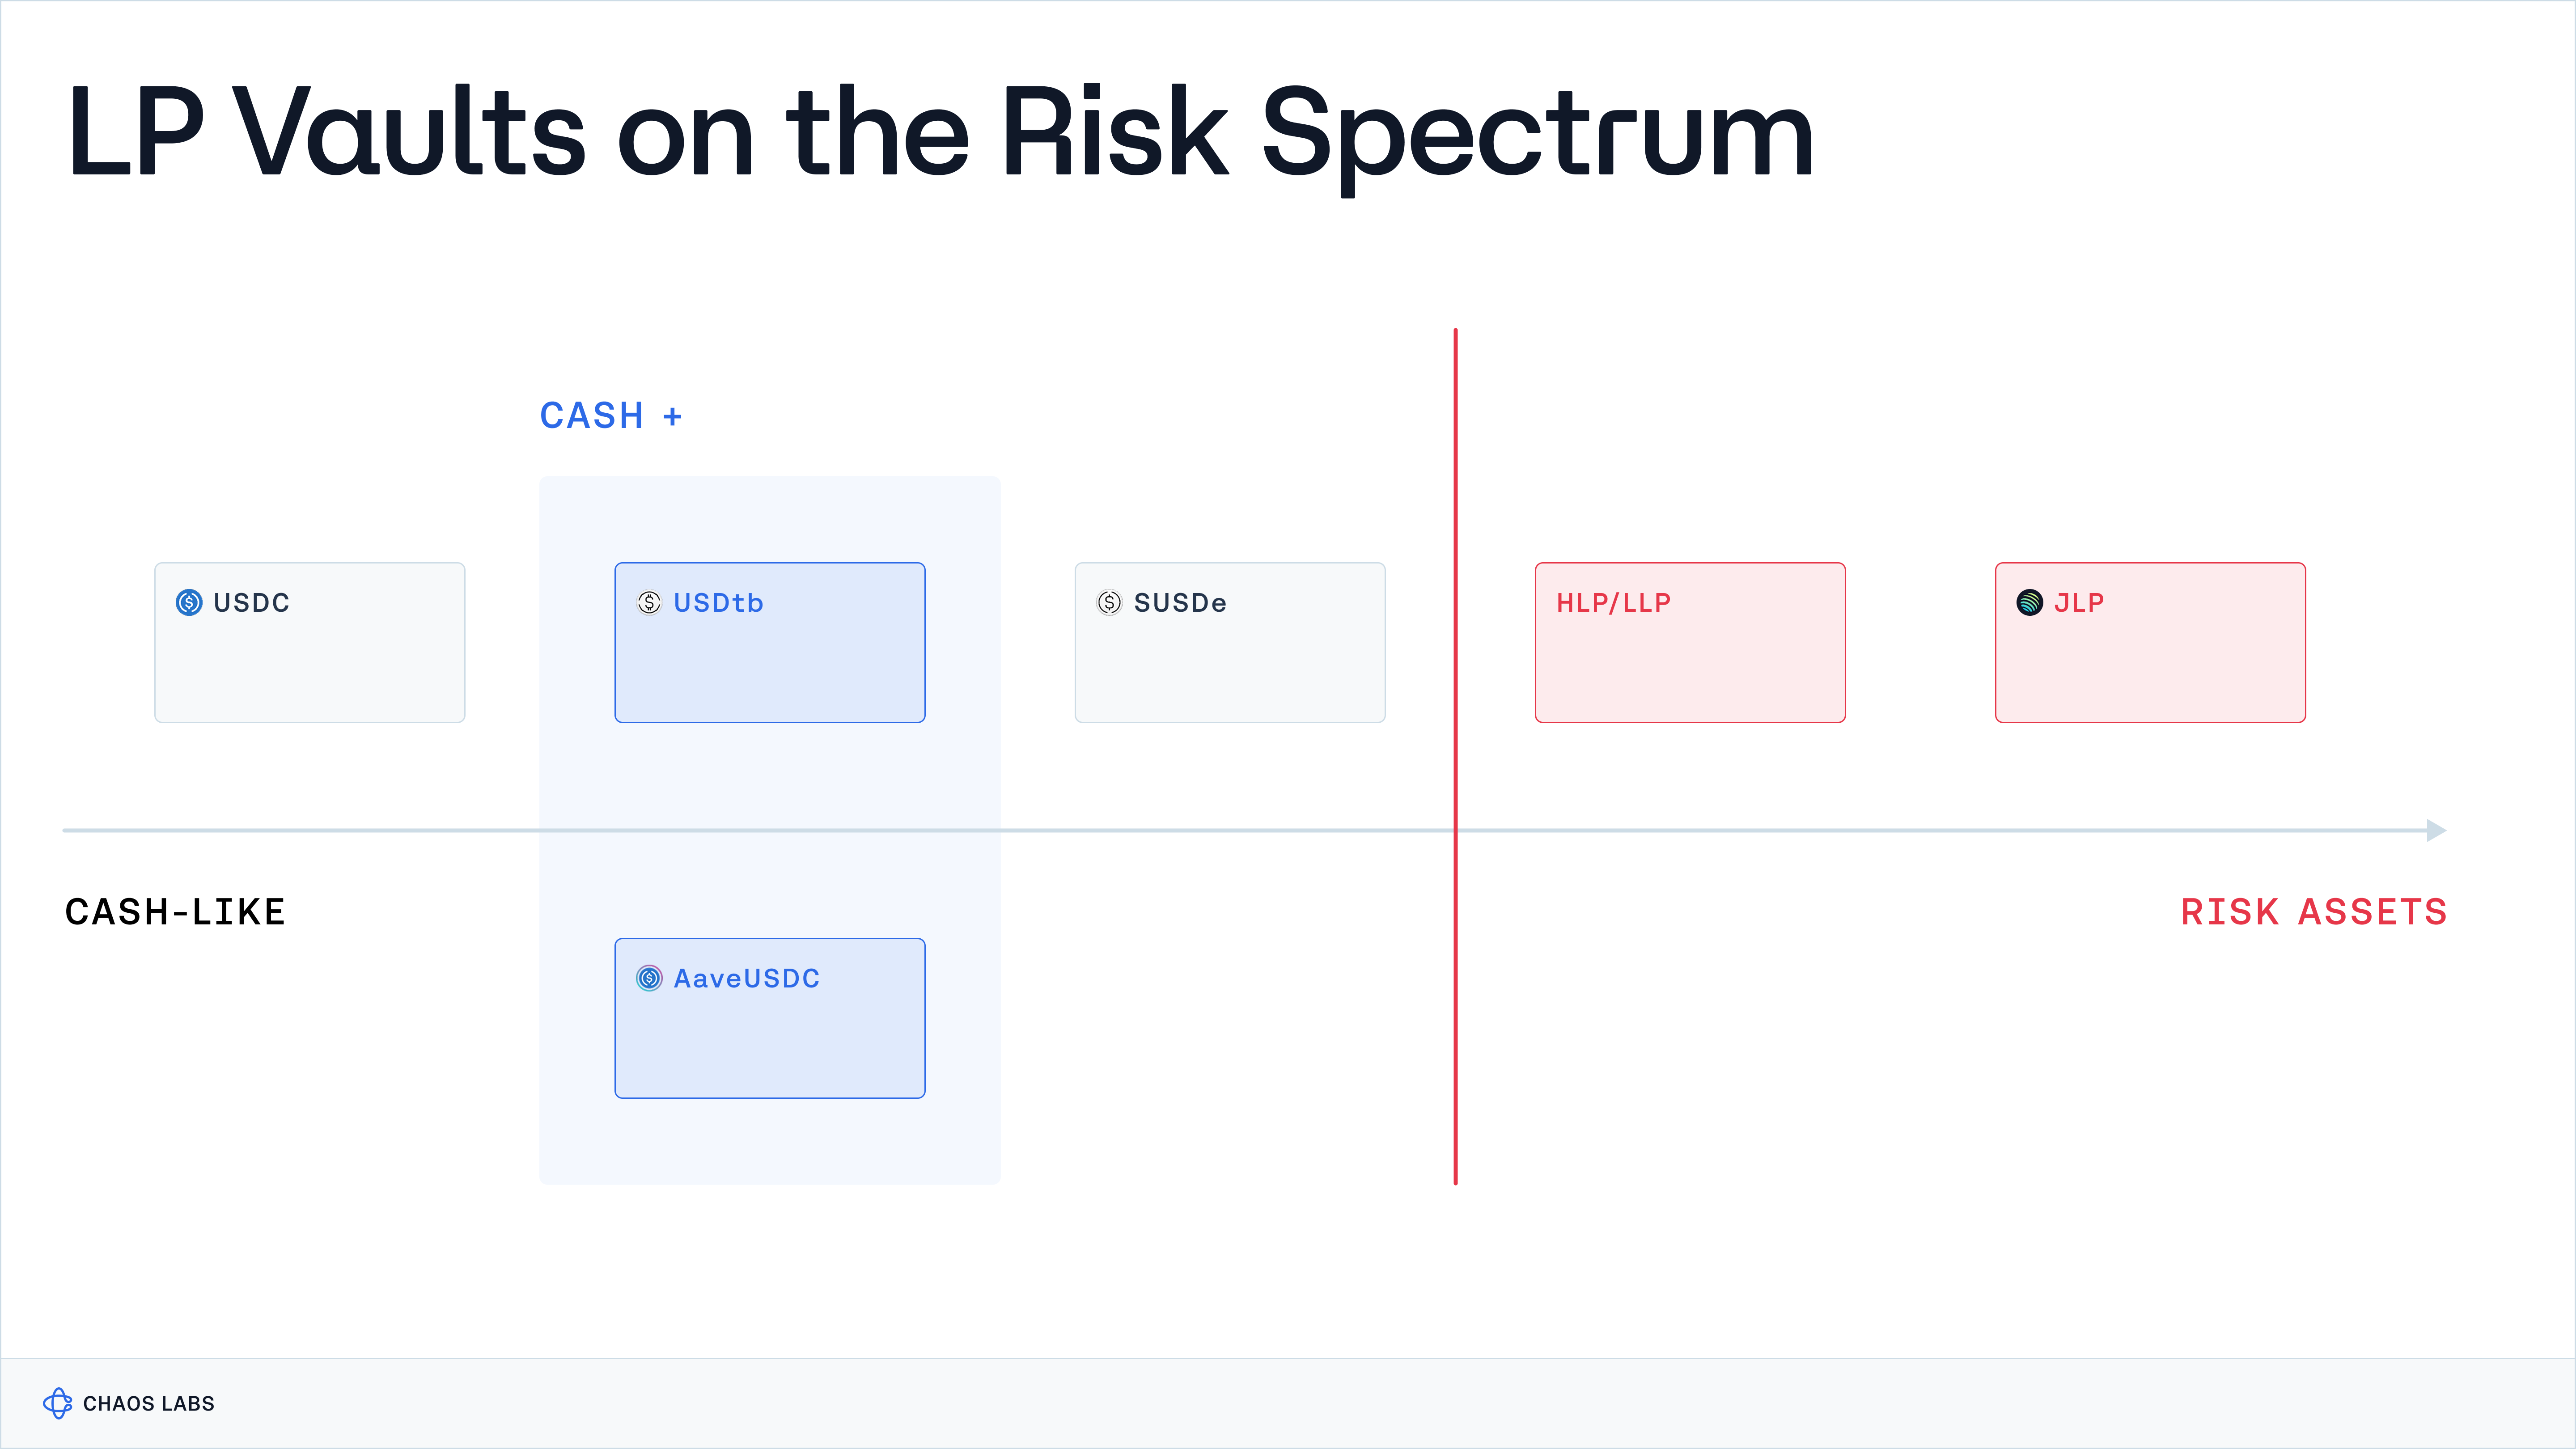
- At one end of the spectrum sits Circle USDC. Abstracting away issuer and regulatory risk, USDC’s design is straightforward: principal remains at $1, yield is effectively zero, and on most major venues large size can be moved at or very close to par within seconds. Users can also redeem funds to their bank account through multiple venues, and the product is supported by large publicly-traded US companies. For practical purposes within crypto markets, USDC functions as cash.
- Next are “cash+” solutions: products with stable principal and yield. Liquidity on these products is typically high, although not as frictionless as holding USDC directly. Two good examples of these are AaveUSDC (USDC deposited in Aave) and short-term t-bill wrappers like Ethena’s USDtb.
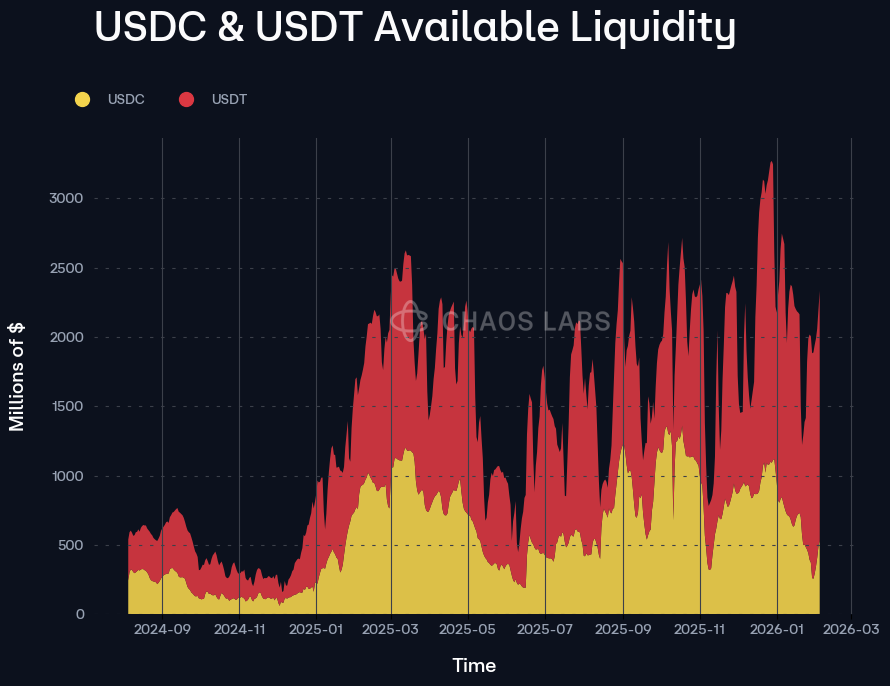
- AaveUSDC has no principal volatility and pays a smooth lending rate. The incremental risk resides primarily in the Aave contracts and the lending book’s health. Liquidity is extremely strong: due to Aave’s pooled architecture and scale, USDC/USDT pools routinely maintain hundreds of millions in available liquidity and have processed multi-billion-dollar withdrawal waves (including during the 10/10/2025 crash) while re-equilibrating.
- USDtb pushes part of the risk into the traditional financial system. The wrapper holds short-dated US Treasuries and passes through the front-end yield. NAVs can fluctuate slightly with interest rates, but drawdowns are minimal and yield volatility is low. Onchain liquidity is strong under normal conditions, though ultimate redemption depends on the wrapper’s rules, banking rails, and KYC processes.
- Synthetic dollars like USDe and sUSDe sit one step further out on the spectrum. USDe is designed to track $1, while sUSDe is the staked wrapper that accrues yield from Ethena’s delta-hedged perp basis trades. That yield is explicitly regime-dependent. In risk-on environments with rich perp funding, sUSDe can print yields well above t-bill levels; in risk-off periods, realised funding compresses toward levels closer to “risk-free” rates. Ethena’s insurance funds are built to absorb drawdowns and historical modelling suggests periods of inverted funding are typically short-lived. Still, principal volatility is not zero and in periods of market stress, USDe/sUSDe can trade at a small discount on secondary markets. On the liquidity side, sUSDe is one of the most liquid “earn” tokens in crypto, with a seven-day unstaking period and underlying redemptions available to whitelisted actors.
- Perp MM vaults including HLP and LLP sit firmly in the risk-asset bucket. While denominated in USDC, they have shown 5–9% drawdowns and multi-month underwater periods. Daily returns follow the market-making profile described earlier: many small positive days, a meaningful share of flat days, and occasional large losses. Yield can be excellent on a Sharpe basis, but it is lumpy and path-dependent. Liquidity is great, i.e., users can redeem at will but always at the current NAV, meaning that exits during drawdowns crystallize losses.
- Finally, JLP sits further out on the risk side. The pool holds spot assets, typically a basket of SOL, ETH, BTC, and stablecoins, and earns fees on top. This structure makes JLP less risky than holding 100% spot exposure since the house edge accrues over time, but it also carries full spot beta. Its NAV moves directly with the underlying tokens plus trading PnL, and liquidity is great across both primary redemptions and secondary markets. In summary, JLP preserves the greatest upside, since it maintains direct exposure to underlying assets rather than fully neutralizing market risk.
4. Conclusion: Takeaways for Onchain Allocators
The data makes one thing clear: perp MM vaults are not cash.
These products typically experience 5-9% drawdowns, can spend months underwater, accrue yield along a noisy path of small gains and occasional large losses, and are exposed not only to market regimes but also to venue-level tail events. At the same time, when treated as risk assets, their risk-adjusted performance can be compelling. LLP and HLP, in particular, have shown high Sharpe ratios and solid average daily returns, especially during their early, high-edge phases.
For allocators, the practical implications are:
- Put them in the right bucket: HLP and LLP, for example, sit closer to trading strategies and structured basis products than to USDC, USDtb, AaveUSDC or even sUSDe. They should be funded with risk capital.
- Size to drawdown is important: MDD and underwater periods should drive sizing decisions. A 5–10% drawdown and three to four months underwater should be treated as a base case rather than a tail event.
- Expect regime shifts: APY is backward-looking. Early, high-edge periods (low TVL, airdrop hunting, favourable market structure) will never repeat indefinitely. As venues mature and capital crowds in, yields tend to compress.
- Price venue and model risk: Allocators underwrite market noise, but also the design of liquidation engines, listing policies, risk controls, and operational processes. JellyJelly, POPCAT, and the Paradex rollback incident will most likely repeat in some form in the future.
- Use MM vaults as part of a stack, not a base layer: These vaults can be effective components of a broader yield or delta-neutral stack, or as a return-seeking sleeve within a stablecoin portfolio. However, they should sit above true cash and cash+ layers, not replace them.
There is no free lunch in DeFi. MM vaults print yield because they warehouse risk.
Yield as a Risk Signal: Part III
If yield is repriced risk, then the critical question becomes: what is the baseline?
Aave Emerges Net Positive After Market Stress
A 10–20% market drawdown triggered elevated liquidations across Aave, with $202.47M of collateral seized against $193.12M of repaid debt over the 7-day period. On a net basis, liquidation activity was economically positive for Aave, with SVR revenue alone exceeding deficit realization.
Risk Less.
Know More.
Get updates on our research, product, and launch.